What this blog covers
Most ecommerce teams trust dashboards that disagree: store orders miss analytics purchases, and ad platforms report more sales than the business banked. This article explains the data layer in plain language, the quiet errors that make revenue reports drift apart, why checkout changes break tracking first, and how a one-day reconciliation test exposes the gap. Ecommerce directors and heads of growth get the Data Layer Trust Chain, Define, Build, Verify, Watch, so budget decisions rest on numbers the business can defend.
Table of Contents
- What a data layer is, and why your dashboards depend on it
- The quiet errors that make revenue reports disagree
- Why checkout changes break tracking first
- The reconciliation test that exposes the gap in a day
- Ecommerce data layer implementation: the Data Layer Trust Chain
- The framework explained
- The 30-day plan to reconcile your data layer with orders
- Why marketing and engineering must share the event spec
- Key takeaways
- The CXO takeaway
Your dashboards are confident. Your numbers disagree. The gap between them is usually a data layer problem, and it is quietly steering your decisions.
Quick answer: Ecommerce data layer implementation starts here: a data layer is a structured record of what happens on your site, a product view, a purchase, that analytics and ad tags read from. Define it loosely and you get duplicate purchases, missing items, mixed currencies and events firing before consent, and every report inherits the errors. Write an event specification, build pushes from your source of truth, verify against orders weekly and monitor for drift.
What a data layer is, and why your dashboards depend on it
A data layer is a structured set of facts about what happens on your website: which product was viewed, what went into the cart and what was bought, at what price and in which currency. Your tag manager reads it and sends the right details to analytics and ad platforms. With it, every tool reads the same facts. Skip it, and each tool scrapes the page its own way and reports its own version of the truth.
Google’s GA4 ecommerce guide shows the pattern: push an event to the data layer, clear the previous ecommerce object first so stale items stay out, and include every field the event needs. A purchase carries a transaction ID, value, currency and items, each with an ID or name. Detail decides which reports are possible.
The business stakes are plain. Every KPI is green and your board should still worry, and a faulty data layer is one of the quietest ways that happens. Wrong revenue feeds wrong budgets. Wrong budgets feed wrong plans.
Ask your analytics lead three questions: where does a purchase event come from, who defined its fields and when did anyone last compare it with orders? Any fuzzy answer means your dashboards rest on an assumption.
The quiet errors that make revenue reports disagree
Most data layer errors are small and silent. A purchase fires twice when a shopper refreshes the thank-you page. An event drops the items array. A currency code goes missing. Value includes tax in one place and excludes it in another. Each looks harmless. Together they distort every report.
Duplication is the commonest and costliest. A missing transaction ID lets a page refresh inflate revenue, and your best customer can get counted three times across platforms. Deduplicate by transaction ID in analytics and by event ID in ad platforms. One sale, one count.
Consent adds a layer. Ad blockers, browser privacy features and consent rejection all cause data loss, varying by site, geography and set-up. A tag firing before consent is a compliance problem as well as a data problem. Build consent into the data layer, from the start.
Platform defaults can mislead. Native integrations often send basic events with thin item data, so full accuracy needs a deliberate set-up. Check what your platform sends before you rely on it. Defaults are a starting point.
Why checkout changes break tracking first
Checkout is where revenue gets counted, so broken tracking costs most there. One goal, many funnels shows how correct tracking proves a design works, and a checkout change can silently remove the very events that prove it. Treat every checkout change as a tracking change. Test both.
Shopify’s move to checkout extensibility shows why. Checkout.liquid and additional scripts were retired for the Thank you and Order status pages, and script-based tracking built on them stopped working. Dashboards still load while conversions quietly under-report, and the result looks like a conversion drop.
Rebuild on supported mechanisms. Shopify’s customer events and web pixels, plus server-side connections, replace script-based tracking, each fed from the same event specification as the rest of the site. Document which mechanism sends which event.
Align ad platform events to the same source. Our Meta Pixel and Conversions API guide covers how events and identifiers should match across browser and server so platforms can deduplicate. One specification feeds every destination. Do the work once.
The reconciliation test that exposes the gap in a day
The fastest way to find a data layer problem is to compare it with orders. Take yesterday’s store orders and compare count, revenue, currency, items and source with analytics and each ad platform. Small differences within tolerance are normal. Large or growing gaps are defects.
Make it routine. Run it weekly, log the gap and keep the history. A rising gap after a release points to the release. A stable gap points to a design limit you can model. History turns anecdotes into evidence.
Eight checks to run before you trust a report
- Purchase count
What to compare: Store orders vs analytics purchase events
Common failure: Duplicates after refresh or missed events
Fix: Deduplicate by transaction ID - Revenue
What to compare: Order revenue vs reported revenue
Common failure: Tax or shipping counted differently
Fix: Send value and currency to the specification - Items
What to compare: Order line items vs items array
Common failure: Missing items or wrong product IDs
Fix: Match item IDs to the catalogue - Funnel
What to compare: View, add to cart, checkout, purchase counts
Common failure: A step stops firing after a release
Fix: Test each step after every release - Consent
What to compare: Events fired vs consent state
Common failure: Tags firing before consent
Fix: Make tags consent-aware - Source
What to compare: Channel parameters on orders vs analytics
Common failure: Parameters lost across payment redirects
Fix: Persist parameters through checkout - Currency
What to compare: Totals across markets
Common failure: Mixed currencies in one total
Fix: Report currency with every value - Ad platforms
What to compare: Platform conversions vs orders
Common failure: Double counting across platforms
Fix: Use shared event IDs to deduplicate
Server-side collection narrows the gap. Server-side tracking and CAPI in a privacy-first world explains how server events recover conversions that browsers drop and let you validate events before they reach platforms. A clean specification makes server-side even more valuable.
Share the result with finance. When analytics revenue sits well below store revenue, finance deserves to know the margin of error before approving a budget built on analytics. Honest error bars build trust.
Ecommerce data layer implementation: the Data Layer Trust Chain
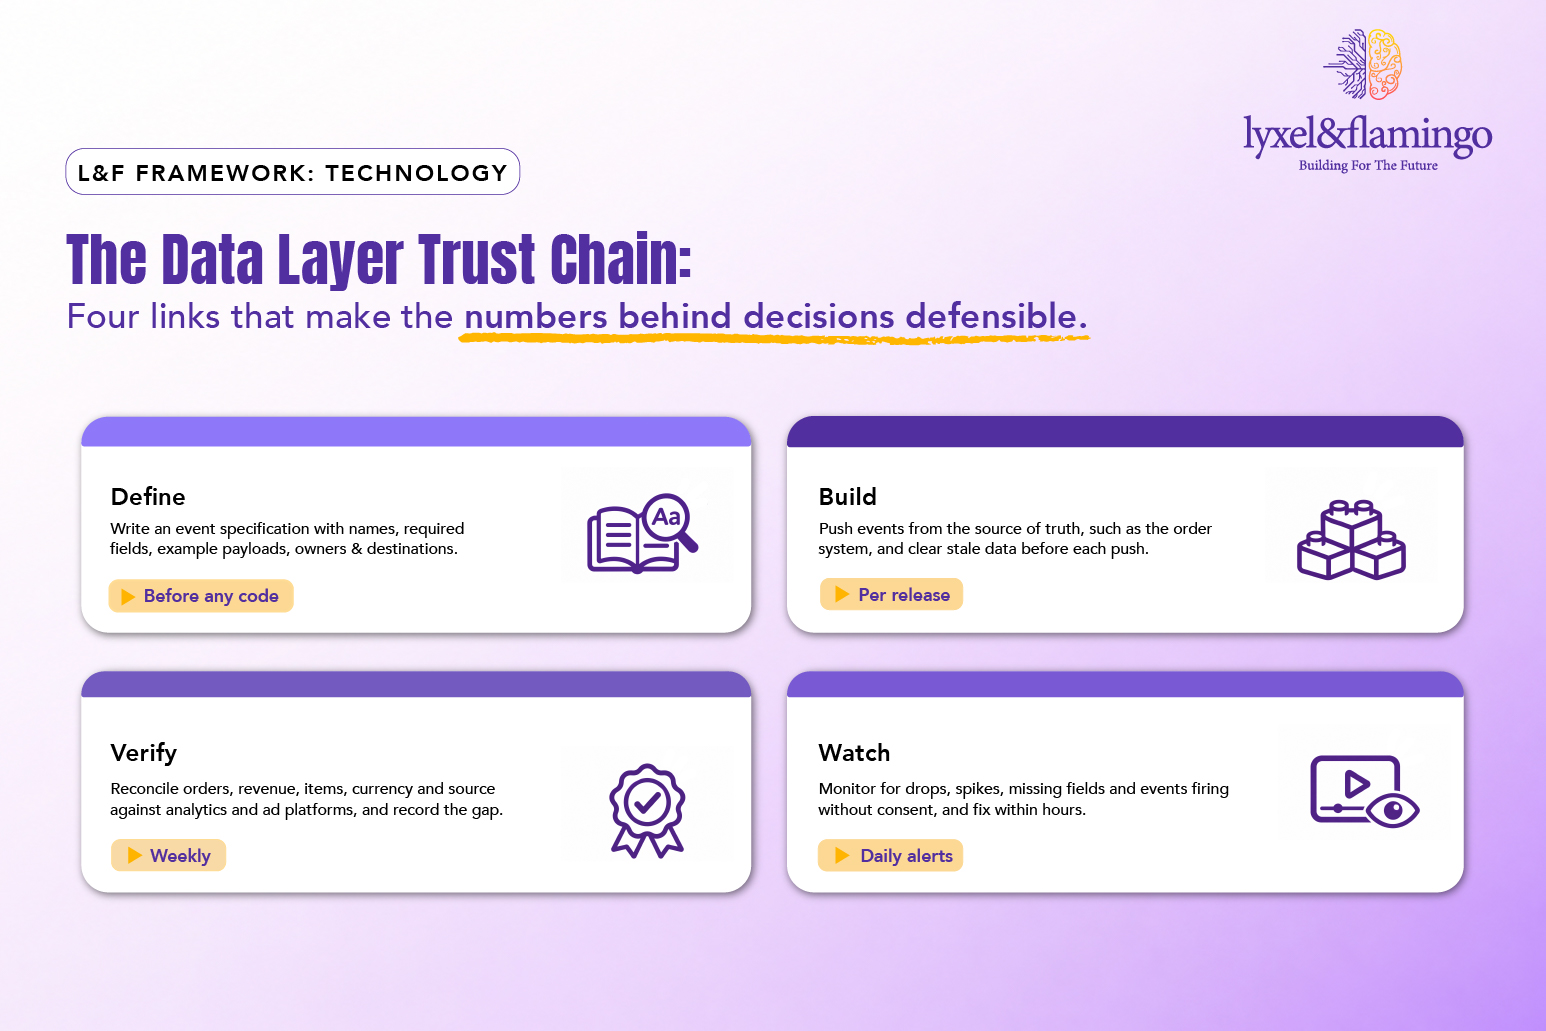
Four links, tested in order, make the numbers behind your decisions defensible.
The framework explained
Define: Write the specification before anyone writes code: every event, its name, required fields, example payload, owning team and destinations, plus currency, tax and shipping rules and the consent condition. Keep it where marketing and engineering can both edit it. A clear specification prevents most errors before they exist.
Build: Push events from the source of truth, the order system, rather than whatever the page displays. Clear stale ecommerce data before each push, put a transaction ID on every purchase and keep item IDs identical to the catalogue. Test in staging, every release.
Verify: Compare data with the business every week. Reconcile a day of orders on count, revenue, items, currency and source against analytics and each ad platform, and log the gap. Share the log with finance so budget decisions carry honest error bars.
Watch: Alert on sudden drops and spikes in purchase events, missing fields, duplicate transaction IDs and events firing before consent, routed to a named person with authority to fix. A failure caught within hours costs little. One found at the monthly review has already shaped decisions.
The 30-day plan to reconcile your data layer with orders
- Days 1 to 7: reconcile. Compare one day of orders on count, revenue, currency, items and source with analytics and each ad platform. List the gaps and who defined each event.
- Days 8 to 15: write the specification. Document each event with name, required fields, example payload, owner, destination and consent condition. Agree it with engineering.
- Days 16 to 25: fix the worst three. Pick the three gaps that distort decisions most, fix them at source, re-test in staging and rebuild checkout tracking on supported mechanisms.
- Days 26 to 30: add the routine. Schedule weekly reconciliation, set daily alerts, show the gap beside the next performance report and name the owner.
Why marketing and engineering must share the event spec
The data layer sits between two teams that rarely read each other’s documents. Marketing wants events that answer business questions. Engineering wants a stable, testable build. When the specification lives in a marketer’s spreadsheet and the code lives with a developer, drift is guaranteed.
Put the specification in one shared, versioned document. A single source of truth for marketing data joins the specification, orders and reports so every team reads the same numbers.
Monitor relentlessly. A failed release should surface in hours. A daily alert costs far less than a quarter of wrong decisions.
Link data quality to outcomes. Marketing ROI proof points connect campaign metrics to business results, and that only works when the underlying events are right. Report the data-quality scorecard beside the performance scorecard.
The Lyxel&Flamingo GA4 and analytics team designs event specifications and rebuilds tracking after platform changes, as covered in why GA4 migration is more than installation.
Key takeaways
- A data layer is the structured record analytics and ad tags read from. Loose definitions produce reports that disagree.
- Duplicate purchases, missing items, mixed currencies and pre-consent events are the commonest quiet errors.
- Checkout changes break tracking first. Treat every checkout change as a tracking change.
- Reconcile a day of orders against analytics and ad platforms weekly, and keep the history.
- Marketing and engineering share one event specification, with monitoring and a named owner.
The CXO takeaway
Ask your analytics lead to compare yesterday’s orders with analytics and each ad platform on count, revenue, currency and source, and bring you the gaps this week. Ask who defined the purchase event, where the specification lives and when it was last tested. Fund a shared event specification and weekly reconciliation before the next large budget decision, and require the gap to sit beside every performance report under one named owner.
The question for your next planning meeting: if your biggest campaign claimed 20% more sales than your store banked, which number would your board believe?
Share your current event list with Lyxel&Flamingo and we will help you find the first gap.
Frequently Asked Questions
A data layer is a structured record of what happens on your website, which product was viewed, what was bought, stored in a form tools can read. Your tag manager reads it and sends the right details to analytics and ad platforms, so every tool works from the same facts.
Common causes are duplicate purchase events, missing events, tax or shipping counted differently, mixed currencies, consent rules and ad blockers. Some gap is normal. Reconcile a day of orders weekly, record the gap and investigate when it grows; a stable, known gap is manageable.
Shopify’s reports work well for orders, while ad platforms and analytics need detailed events. Native integrations often send basic events with incomplete item data, so full product-level reporting needs a deliberate set-up. Check what your current set-up sends before deciding.
Run a light reconciliation weekly, test tracking after every release or checkout change, and do a full audit each quarter and before major sales. Add automated alerts for drops, spikes and missing fields. Frequent small checks cost far less than rare large clean-ups.
Name one accountable owner, often a head of analytics or growth engineering, with authority across marketing and engineering. Marketing defines what to measure, engineering builds and maintains events, finance receives the error bars, and the specification lives in a shared, versioned document.