
What This Blog Covers
Most media measurement stacks are built to answer “did this campaign hit its target”, a question that says very little about whether the brand is actually building durable demand. Leading indicators, brand search volume, share of search, incrementality, get treated as secondary metrics when they’re often the ones that predict where lagging metrics like revenue are headed next. Here’s what CXOs should actually be optimising toward, and why the easy number is so often the wrong one.
Table of Contents
- Green Across the Board Can Still Mean Nothing
- Lagging Metrics: Confirmation, Not Prediction
- Leading Indicators: What Actually Predicts Next Quarter
- Incrementality: The Question Most Dashboards Never Ask
- Building a Measurement Stack CXOs Can Actually Trust
- The Lagging vs Leading KPI Model: what each type of metric actually tells a CXO
- The Framework Explained
- What the Right Measurement Stack Protects
- Key Takeaways
- The CXO Takeaway
- The Question to Sit With
- Closing
Green Across the Board Can Still Mean Nothing
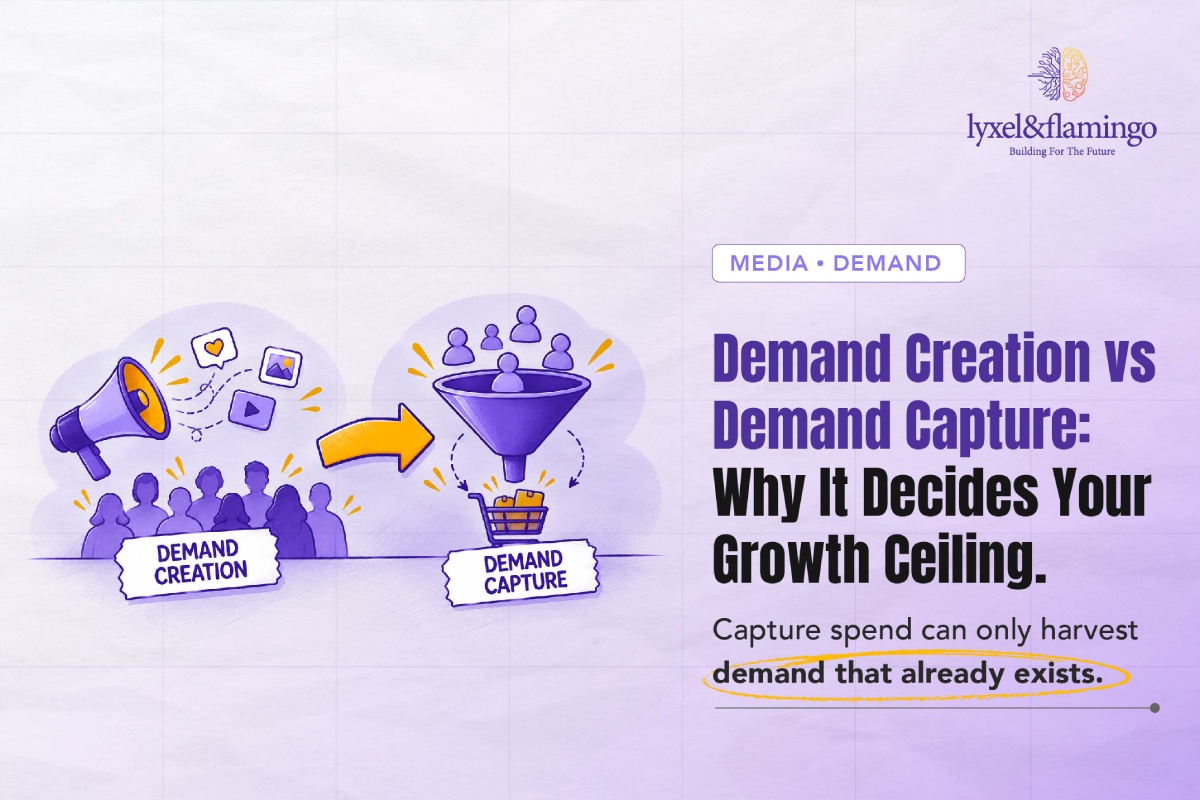
A dashboard built entirely around channel-level targets, ROAS by platform, CPA by campaign, can show green everywhere while the brand’s actual demand is flat or declining. Channel-level targets say nothing about whether spend created new demand or simply captured demand that already existed.
This is how a quarter looks successful on every individual media report and still leaves a CXO with no real answer to the question that matters: is the brand growing, or is spend just getting more efficient at capturing what was already there.
Lagging Metrics: Confirmation, Not Prediction
Revenue, orders, last-click ROAS. These are lagging indicators. They confirm what already happened, days or weeks after the decisions that caused it, which makes them useful for reporting and close to useless for steering a campaign that’s still running.
A media stack reporting only lagging metrics hands a CXO an accurate rear-view mirror and no windshield. A dashboard that explains last quarter well and offers no real signal about the one now starting.
Leading Indicators: What Actually Predicts Next Quarter
Brand search volume and share of search move ahead of revenue, often by weeks. An increase in people actively searching for a brand by name tends to precede an increase in people buying from it, which makes these leading indicators genuinely predictive, not merely descriptive.
Tracked consistently, as a forecasting input rather than a vanity metric, they let a CXO see a demand shift coming before it shows up, already lagging, in the revenue line.
Incrementality: The Question Most Dashboards Never Ask
Attribution answers “which channel touched this conversion.” Incrementality testing answers the harder, more useful question: “would this conversion have happened anyway, without the spend.” Most dashboards never ask the second question, crediting spend for demand it may never have actually created.
Geo-lift tests and holdout groups answer that question with evidence rather than assumption. A CXO relying purely on attribution, without ever running one, is likely overstating what paid media is actually contributing.
Building a Measurement Stack CXOs Can Actually Trust
A trustworthy stack blends lagging metrics for reporting accuracy with leading indicators for forward signal and periodic incrementality testing for a genuine read on causation, rather than leaning entirely on whichever number is easiest to pull from the ad platform’s own dashboard.
Getting this mix right is less about new tooling and more about which numbers a CXO actually asks to see in the monthly review. The questions asked shape which numbers a team ends up optimising toward.
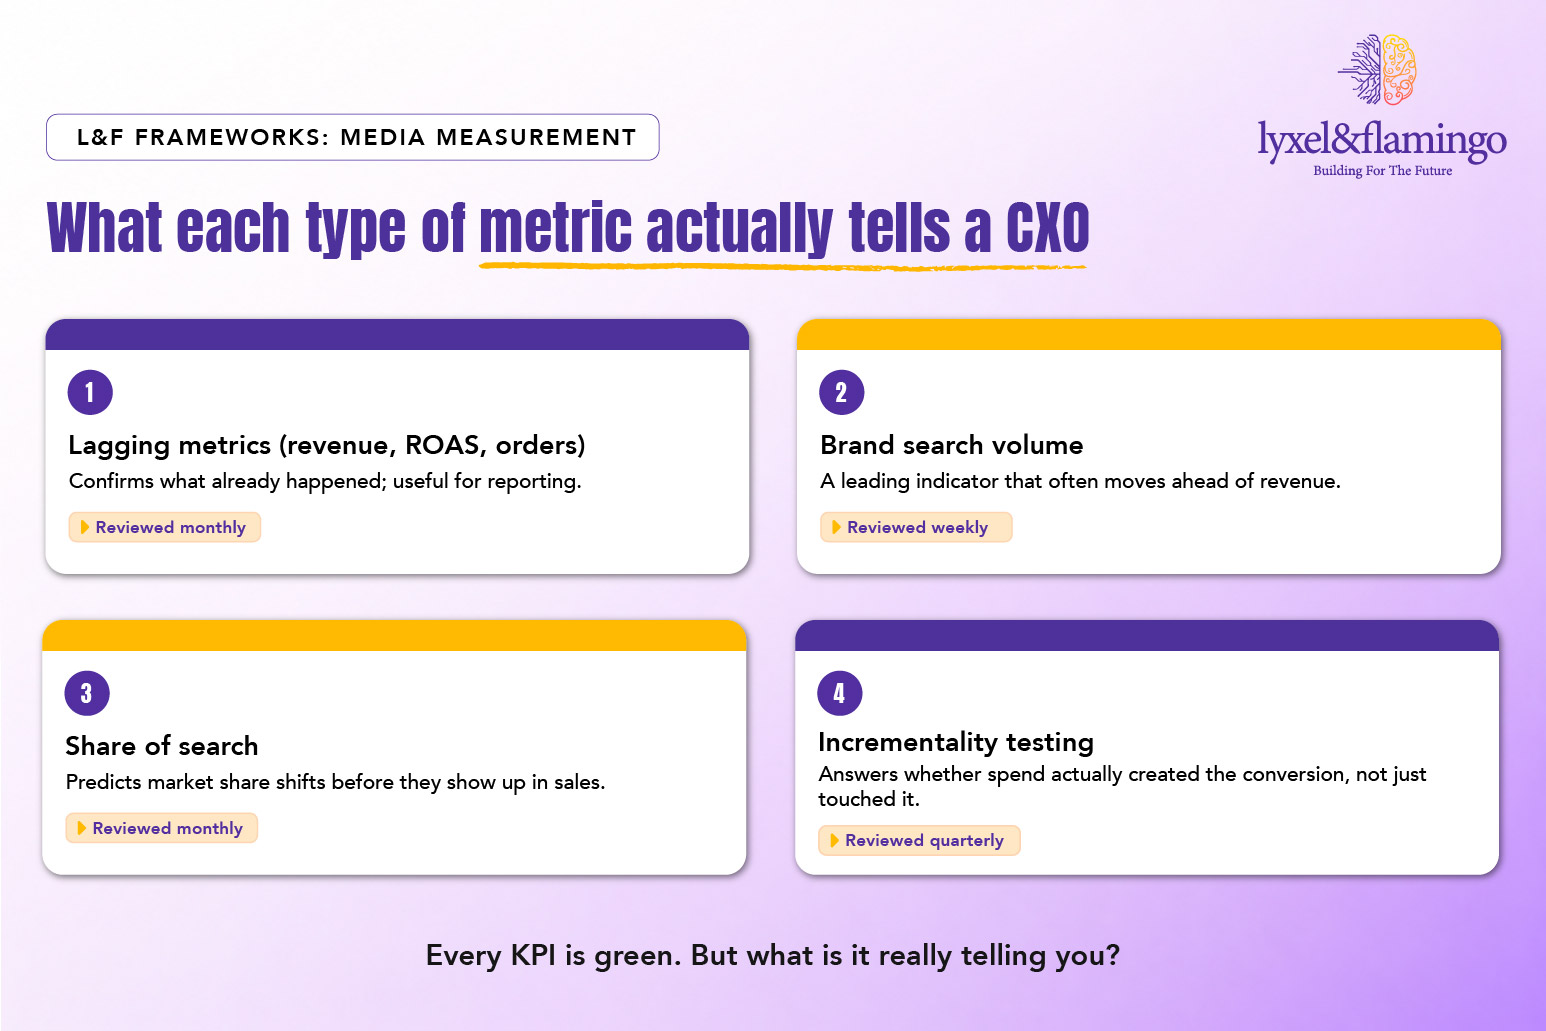
The Lagging vs Leading KPI Model: what each type of metric actually tells a CXO
The Framework Explained
- Lagging metrics (revenue, ROAS, orders): Lagging metrics confirm what already happened, days or weeks after the decisions that caused it. Useful for a report. Close to useless for steering a campaign that is still running, which is exactly the moment a CXO actually needs a signal.
- Brand search volume: An increase in people actively searching for a brand by name tends to arrive weeks before the increase in people buying from it. Tracked as a forecasting input, not a vanity number glanced at once a quarter, it is one of the few numbers that lets a CXO see a demand shift coming before revenue confirms it, already late.
- Share of search: Share of search moves before market share does, which makes it one of the earliest tells a brand has that it is winning or losing category attention, well before that shift shows up anywhere near a sales report.
- Incrementality testing: Attribution answers which channel touched a conversion. Incrementality answers whether that conversion would have happened anyway, without the spend, and most dashboards never bother asking it. Skip it, and a brand is very likely crediting spend for demand it never actually created.
What the Right Measurement Stack Protects
CLIENT PROOF POINT: confirm sign-off before publish. McAfee‘s full-funnel campaign across Singapore and Malaysia shows what measurement built beyond single-channel ROAS delivers: sales grew 42%, traffic grew 170%, credited to campaigns measured and managed across the full funnel rather than optimised to one lagging, channel-level number in isolation. (L&F client work, multi-region full-funnel campaigns.)
Our Media services team builds measurement stacks that blend leading and lagging indicators for leadership reporting.
Key Takeaways
- A dashboard built entirely around channel-level targets can show green everywhere while actual brand demand stays flat.
- Lagging metrics, revenue, ROAS, orders, confirm what already happened; they don’t predict what’s coming next.
- Brand search volume and share of search move ahead of revenue, often by weeks, making them genuinely predictive.
- Incrementality testing answers a harder question than attribution: would this conversion have happened anyway, without the spend.
- McAfee’s full-funnel campaign, measured beyond single-channel ROAS, grew sales 42% and traffic 170% across two markets.
The CXO Takeaway
For a CXO, the question worth asking in the monthly review isn’t whether every channel hit target. It’s whether anyone can show, with evidence, that spend created demand rather than simply captured demand that already existed. A dashboard weighted toward leading indicators and incrementality testing answers that. One built entirely on lagging metrics cannot.
The Question to Sit With
Stop asking whether every channel hit target. Ask whether the brand actually knows, with evidence, that spend created demand rather than simply captured it.
Closing
Lyxel&Flamingo builds measurement stacks that blend leading indicators, lagging metrics and real incrementality evidence, not just whichever number the ad platform surfaces first. Want a clear read on whether your current dashboard is actually predictive or just confirmatory? Start that conversation with L&F →
Frequently Asked Questions
Because channel-level targets like ROAS and CPA are lagging metrics that confirm what already happened, and say nothing about whether spend actually created new demand rather than captured demand that already existed.
A metric like brand search volume or share of search that tends to move ahead of revenue, giving a forward signal rather than only a historical confirmation.
Whether a conversion would have happened anyway without the ad spend. A different and more useful question than attribution, which only shows which channel touched the conversion.
Quarterly is a reasonable standing cadence for most brands, using geo-lift tests or holdout groups to get an evidence-based read on what spend is actually contributing, rather than relying purely on attribution.