
What This Blog Covers
A 10-day sale budget spent evenly across 10 days is a budget that runs out on day 3 and sits idle on day 9. Festive shopping doesn’t arrive in equal daily portions, and neither should your spend.
Amazon sponsored ads budget pacing during a major sale event needs to track actual shopper behavior across the sale window, not a flat daily average. This covers how demand actually distributes across a 10-day sale, and the day-by-day pacing model that keeps budget available when demand peaks instead of running dry early.
Quick Answer: A typical 10-day marketplace sale sees roughly 40 to 50 percent of total demand concentrated in the first 48 hours and the final 24 hours, with a quieter middle stretch in between. Pacing budget evenly across all 10 days routinely means running out of budget during the opening surge or the closing rush, exactly when auction competition and conversion intent are both highest. A day-by-day pacing model, weighted toward the open and close, with a deliberately conservative middle-stretch allocation, captures more of the highest-intent demand for the same total spend.
Table of Contents
Why Flat Daily Pacing Fails
Dividing a sale budget evenly by 10 days feels like the safe, disciplined approach. It assumes shopper demand itself is flat across the sale window, which it isn’t. Real marketplace sale traffic spikes hard at the open, when the biggest discounts and the most motivated deal-hunters are active, and again at the close, as procrastinators and comparison-shoppers make final decisions.
A flat daily budget either runs out mid-day during these peaks, missing the highest-intent traffic of the entire sale, or sits underspent during the quieter middle days, wasting budget efficiency during a stretch of the sale most brands could afford to spend less aggressively on.
How Demand Actually Distributes Across 10 Days
The opening 48 hours typically carry the heaviest traffic and the highest competitive intensity, as every seller in the category launches their sale creative and budget simultaneously. This is also when the platform itself is actively promoting the sale most heavily.
The middle days, roughly day 3 through day 7, see meaningfully lower traffic and lower CPCs, since the initial rush has passed and the closing urgency hasn’t started yet. This is the window where budget efficiency is actually highest per rupee spent, even though total volume is lower.
The final 24 to 48 hours see a second, often sharper spike, as shoppers who were undecided make a final call before the sale ends, often converting at a higher rate than the opening rush because the decision has already been made, only the timing was in question.
The Day-by-Day Pacing Model
The practical fix is allocating a larger share of total budget to the opening and closing windows and a smaller, more efficient share to the middle stretch, rather than 10 equal daily slices. This isn’t a guess, it’s built from the actual traffic and conversion pattern the sale event produces every year.
Pacing is the input. The marketplace KPIs every CXO should track during festive sales is the output side of the same event, the numbers that confirm whether this pacing model actually held up once the sale is over.
The AMS Budget Pacing Framework
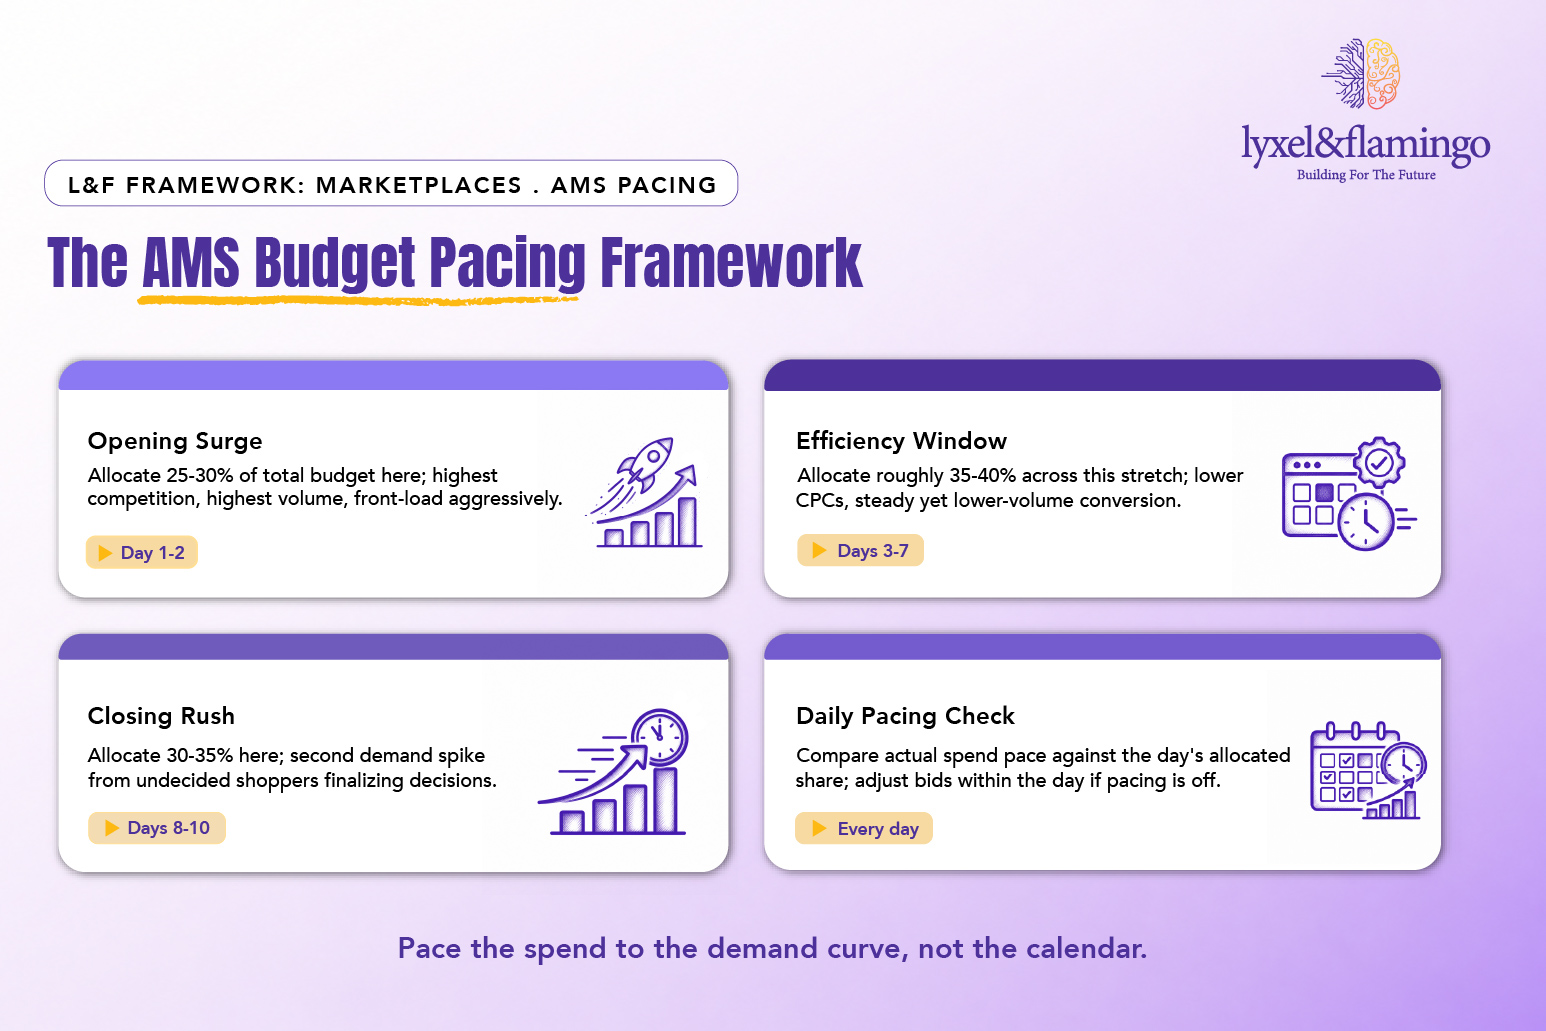
Framework Explained
- Opening Surge: Front-loading budget here captures the highest-volume window of the entire sale, even though competition and CPCs are also at their highest.
- Efficiency Window: This is where the same rupee buys more impressions and clicks, making it the right stretch to sustain visibility efficiently rather than pulling back entirely.
- Closing Rush: This spike is easy to underestimate because it’s smaller than the opening surge in raw traffic, yet often converts at a higher rate, since intent has already firmed up.
- Daily Pacing Check: A phase-level allocation still needs daily monitoring, since actual demand can shift year to year and a rigid plan that ignores real-time pacing data misses the point of having one.
Monitoring and Adjusting Mid-Sale
Daily spend-pace tracking against the phase allocation is what makes this model work in practice, not just in the plan. If the opening surge is running hotter than the historical pattern suggests, shifting a little more of the efficiency-window budget forward is a better response than sticking rigidly to a pre-set daily number.
What This Looks Like at Scale
ASICS’ AMS launch performance work with Lyxel&Flamingo delivered 100% sales growth, 38 million impressions, and a 60% reduction in ACoS, the kind of result that depends on budget being available exactly when demand peaks, not evenly distributed across a sale window that never actually behaves evenly.
The Amazon Great Indian Festival vs Flipkart Big Billion Days 2026 seller readiness checklist covers the broader operational preparation this pacing model sits inside.
Key Takeaways
- Flat daily budget pacing misses the two biggest demand spikes of a 10-day sale: the opening surge and the closing rush.
- The middle stretch of a sale typically has lower volume, yet higher efficiency per rupee spent.
- Allocate roughly 25–30% to the opening, 35–40% to the middle efficiency window, and 30–35% to the close.
- Monitor daily spend pace against the plan and adjust in real time rather than sticking rigidly to a pre-set number.
CXO Takeaway
A sale budget that runs out on day 3 isn’t a budget problem; it’s a pacing model problem. Ask whether your team’s allocation reflects the actual shape of demand across the sale window, not an even daily split.
If your AMS budget for the last major sale ran out before the closing rush, was the total spend wrong, or was the pacing?
Talk to Lyxel&Flamingo about building a day-by-day AMS pacing model for your next major sale event.
Frequently Asked Questions
Because real demand isn’t flat across the sale window, it spikes at the opening and again at the close, and an evenly split budget either runs out during those peaks or sits underspent during the quieter middle days.
The opening 48 hours usually carry the heaviest traffic and competition, with a second, often higher-converting spike in the final 24 to 48 hours as undecided shoppers finalize decisions.
Roughly 25-30% to the opening two days, 35-40% across the middle efficiency window, and 30-35% to the closing two to three days, adjusted based on daily pacing data.
Yes. Daily spend-pace should be monitored against the plan, and budget shifted between phases if actual demand runs hotter or cooler than the historical pattern the plan was built on.