What This Blog Covers
Most festive sale reviews stop at revenue and ACOS, which hides where margin is quietly eroding. This piece lays out the KPI stack CXOs and heads of e-commerce should track before, during, and after a festive sale event, tying each metric to the decision it should trigger. It closes with a simple daily dashboard framework built for the pace of a 10-day sale rather than a quarterly review.
Quick Answer: The KPIs that matter most during festive sales on Amazon, Flipkart, and Myntra are blended ROAS across ads and organic, true contribution margin after ad spend and returns, Buy Box or listing win rate, new-to-brand share, and daily pacing against plan. Revenue and ACOS alone hide where margin is actually being lost. A CXO dashboard should refresh daily through the sale window and roll up into a full margin reconciliation within a week of close.
Table of Contents
Why Revenue Growth Alone Is a Dangerous Festive Metric
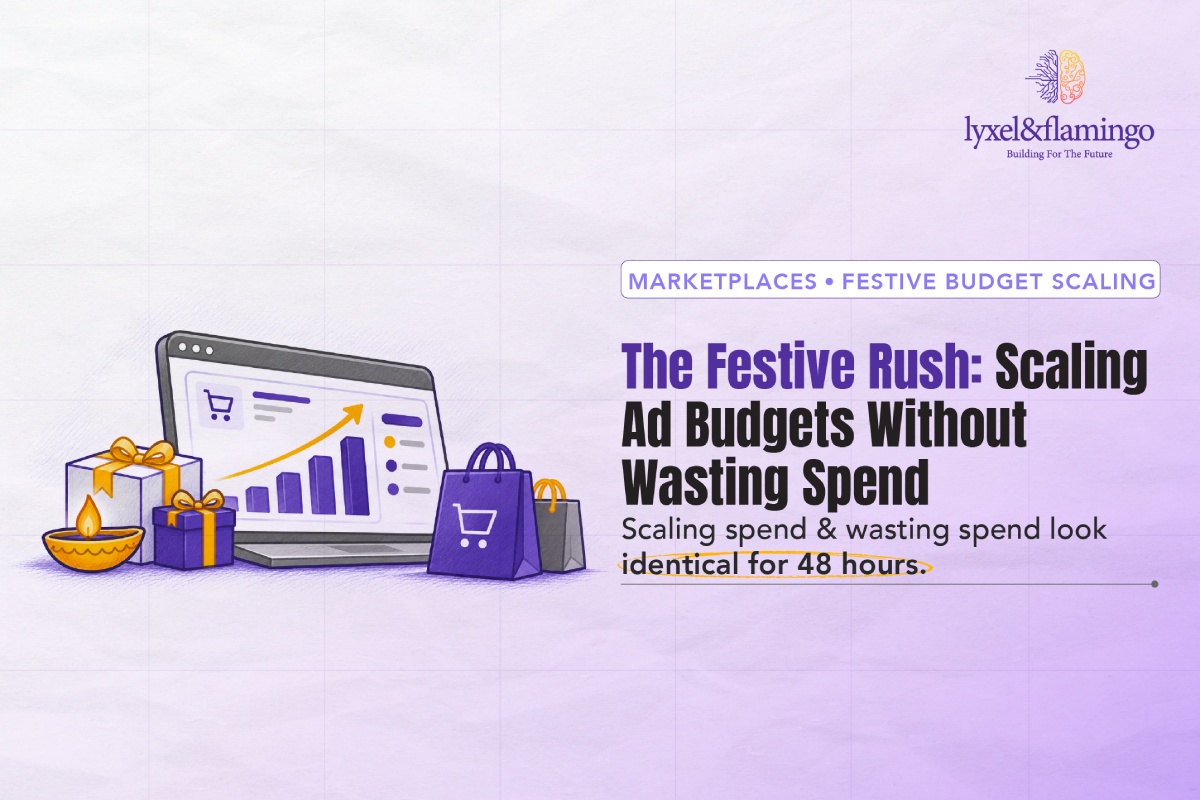
A festive sale can post 3x or 4x normal revenue and still be a worse business decision than sitting it out. Deep discounting, coupon stacking, and aggressive top-of-search bidding all inflate the topline while quietly compressing the margin underneath it. By the time returns land two to three weeks later, the sale that looked like a win in the daily revenue chart can turn into a net loss once the full picture settles.
Inventory and Buy Box dynamics make this worse during peak windows, since a brand chasing revenue can end up out of stock on its best sellers precisely when demand peaks, handing the Buy Box to a competitor for the rest of the sale. Our festive season inventory and Buy Box strategy guide goes deeper into that specific failure mode.
The fix starts with what leadership chooses to look at first. A dashboard that opens on revenue trains every downstream decision to protect revenue, even when margin is the number actually at risk.
The Five KPIs That Belong on a CXO Dashboard
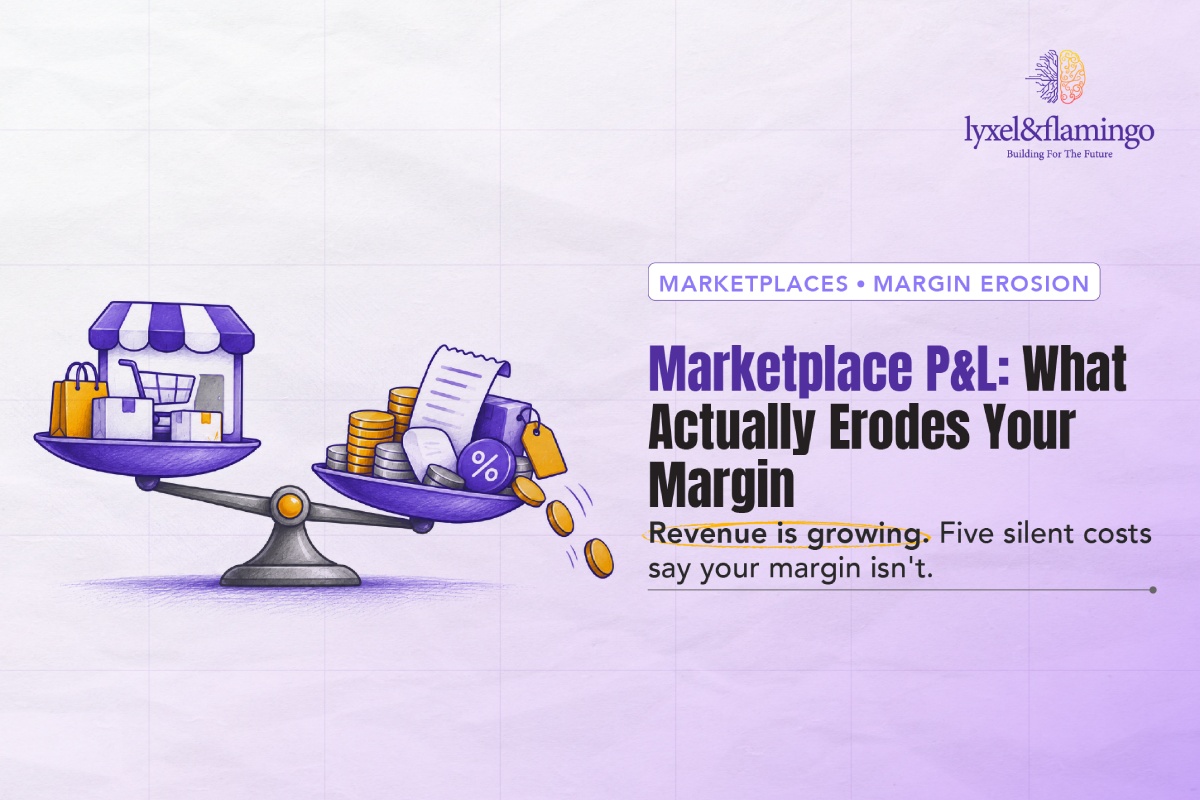
Five metrics consistently separate festive sales that compound brand value from ones that just move inventory at a loss. Blended ROAS combines paid and organic performance so leadership sees the true return on the sale, not just what the ad platform reports. Contribution margin after ad spend, discounts, and expected returns shows whether the sale is actually profitable once every real cost is netted out. Marketplace P&L: what actually erodes your margin on Amazon and Flipkart breaks down the costs that feed into this number, including referral fees, storage costs, and return processing, beyond what a festive-specific dashboard alone can show.
Buy Box or listing win rate flags discoverability problems in real time, often days before they show up as a revenue dip. New-to-brand share measures whether the sale is acquiring genuinely new customers or simply giving existing ones a steeper discount. Winning new-to-brand customers when every competitor discounts at once goes deeper into what actually drives that number up without just buying it with deeper discounts. Pacing against plan, tracked daily, is what lets a team course-correct mid-sale instead of discovering the miss in a post-mortem.
Each of these answers a different question a CXO actually needs answered during the sale, not after it. Together they replace the single revenue number with a fuller, faster-moving picture of sale health.
Blended ROAS vs Platform ROAS: Why the Gap Matters
Platform-reported ROAS on Amazon or Flipkart Ads only counts what the platform’s own attribution window captures, which overstates the true return in two ways. It ignores organic sales that would likely have happened anyway, and it rarely nets out post-sale returns, which spike after festive events far more than during a normal month.
Blended ROAS corrects for both by pulling ad spend, total sales (paid plus organic), and return rates into one view. Tools like Amazon Marketing Cloud make this kind of cross-channel, deduplicated attribution possible at the SKU level, which matters far more during a festive window than a quarterly average ever will.
The gap between platform ROAS and blended ROAS is itself useful information. A wide gap usually means a brand is paying to win sales it would have won anyway, which is exactly the kind of spend a tighter festive budget should cut first. That gap becomes especially important during the festive bidding war, when rising CPCs make it tempting to read platform ROAS at face value instead of asking what organic would have delivered anyway.
Buy Box Win Rate as a Leading Indicator
Buy Box win rate on Amazon and its Flipkart equivalent predict revenue before revenue actually moves, which is why it belongs on a daily dashboard rather than a weekly one. A drop in win rate, whether from a stockout, a price mismatch, or a shipping delay, removes a listing from the default purchase path even while the product page itself still looks fine.
During a festive sale, competitors are pricing and restocking aggressively too, so Buy Box share can shift within hours rather than days. A brand watching only revenue will see the effect a day or two late, after the damage to that SKU’s sale-period ranking is already done.
Treating Buy Box win rate as an early-warning metric, with a same-day escalation path to fix pricing or inventory, keeps small problems from compounding into a lost sale window for a hero SKU.
The Festive KPI Tracking Framework
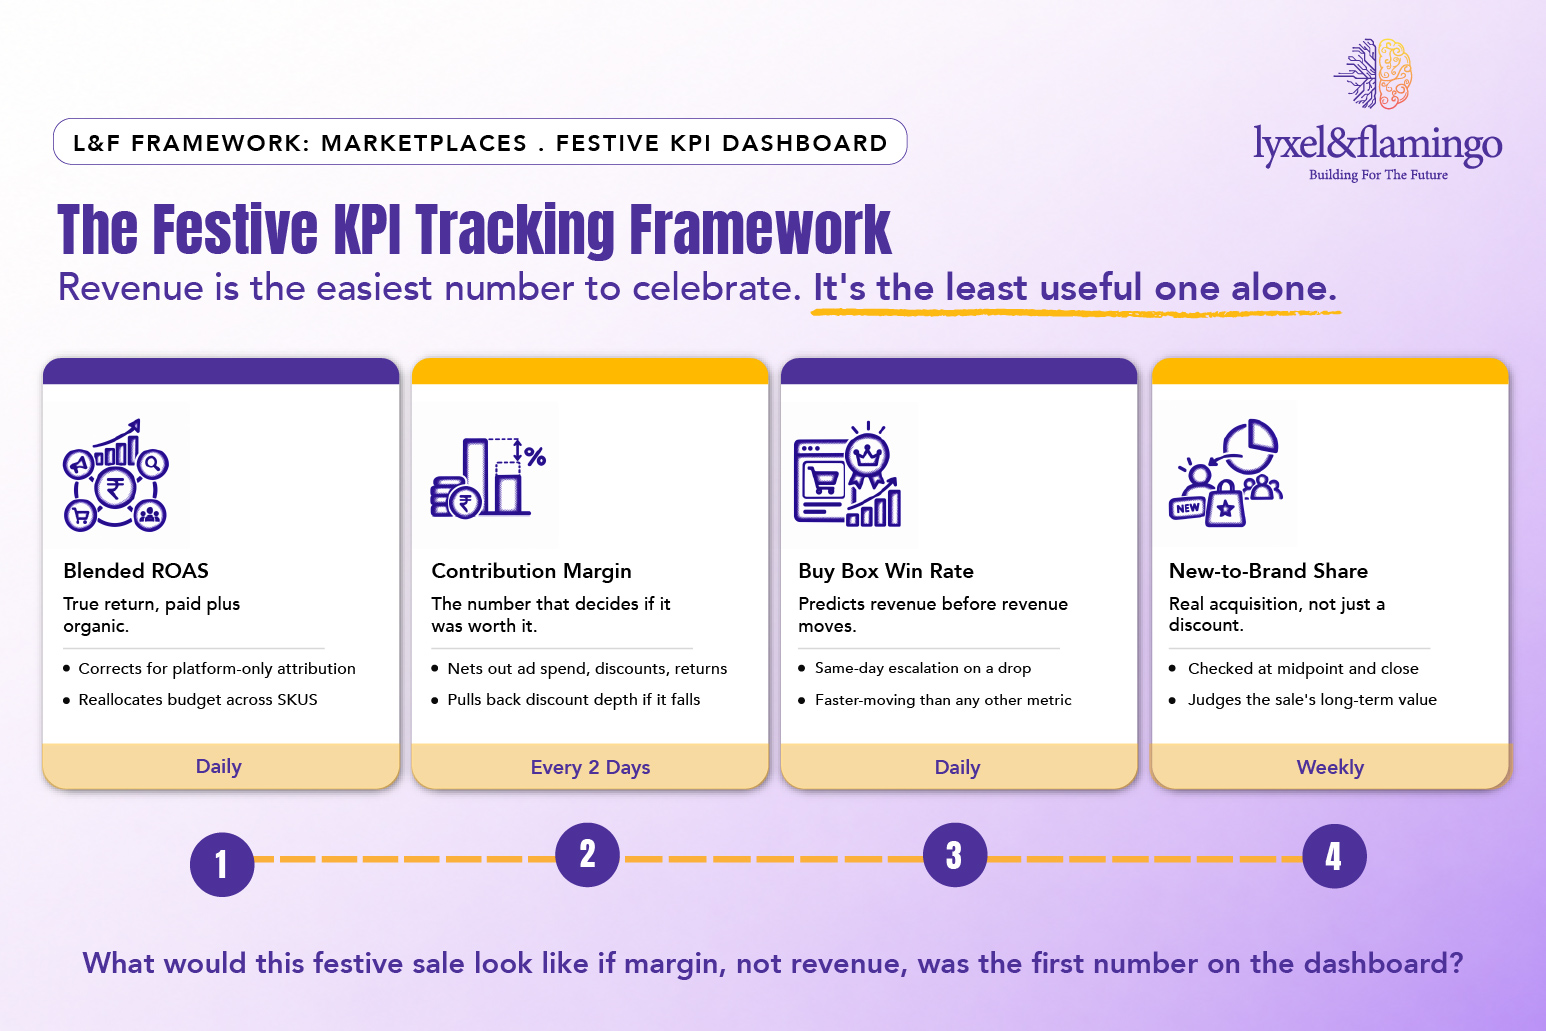
The table below maps each KPI to how often it should be checked, who owns the check, and the specific decision it should trigger. This is the structure worth building into a live dashboard before the sale starts, not during it.
Framework Explained
- Blended ROAS catches spend that looks efficient on the platform’s own dashboard, yet is actually buying sales that organic would have won anyway.
- Contribution Margin is the number that actually decides whether the sale was worth running, since revenue and ACOS alone can both look healthy while margin quietly disappears.
- Buy Box Win Rate moves faster than any other metric on this list, which is exactly why it needs a same-day response process rather than a weekly review.
- New-to-Brand Share separates real growth from discount-driven repeat purchases, which matters most when planning next year’s festive budget.
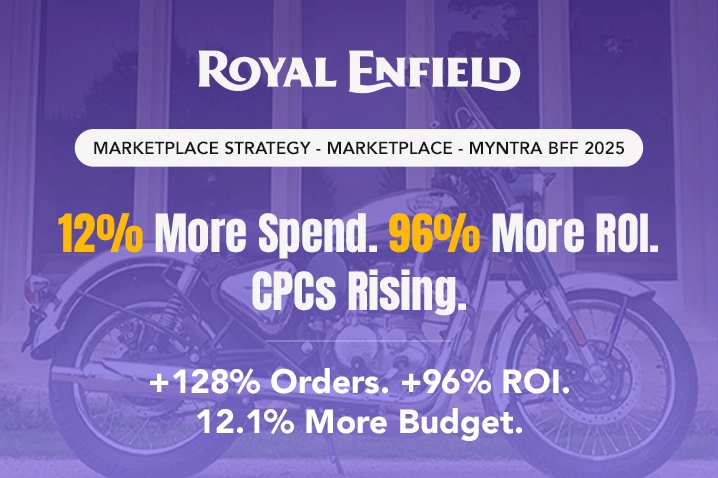
✓ CLIENT PROOF POINT: Royal Enfield went into Myntra’s Big Fashion Festival holding to a profitability-first approach rather than chasing volume with discounts. By mapping incremental spend to the highest-converting placements and reserving top-of-search bidding for the highest-intent share of budget, the brand grew orders by 128% and nearly doubled ROI, on a spend increase of just 12.1%. Read the full Royal Enfield case study.
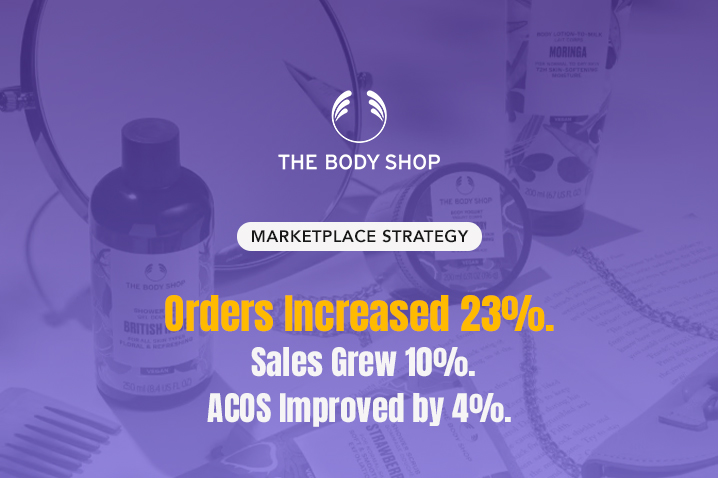
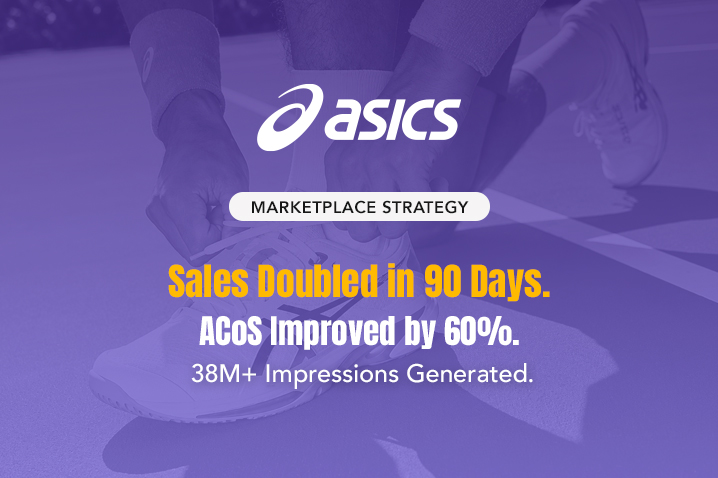
Lotto Sport’s marketplace work with Lyxel&Flamingo and The Body Shop’s festive performance tell the same story from two more categories: the KPI stack that protects margin during a festive sale looks the same whether the category is two-wheelers, footwear, or personal care. Explore Lyxel&Flamingo’s marketplace strategy insights for more examples of performance and profitability-focused campaigns.
Key Takeaways
- Revenue and ACOS alone hide where festive sale margin is actually being lost.
- Blended ROAS, contribution margin, Buy Box win rate, new-to-brand share, and daily pacing form a fuller dashboard.
- Buy Box win rate is a leading indicator and deserves a same-day escalation process during peak windows.
- New-to-brand share is what turns a discount event into a genuine acquisition channel worth repeating.
- A margin reconciliation within a week of sale close, before returns fully land, gives the truest read on performance.
CXO Takeaway
What would this festive sale look like if margin, not revenue, was the first number on your dashboard? Most sale reviews are built backward from a topline number that was never designed to reveal profitability. A tighter KPI stack, tracked daily and owned across performance, category, and operations teams, catches problems while there is still time in the sale window to fix them. Lyxel&Flamingo’s third-party marketplace team can help build that dashboard ahead of the next big sale event.
Frequently Asked Questions
Contribution margin after ad spend, discounts, and expected returns, since revenue and ACOS can both look healthy while margin quietly disappears underneath them.
Daily at minimum, with a same-day escalation path specifically for Buy Box and pricing issues, which move faster than any other metric on the list.
Yes, arguably more than in a normal-priced sale, since it flags whether the sale is genuinely acquiring new customers or just giving existing ones a steeper price.
Within a week of close, ideally before post-sale returns and cancellations have fully landed, so the number reflects reality rather than an optimistic early read.