What this blog covers
Automated traffic now makes up more than half the web, and much of it is hostile: bots that click ads, scrape prices and catalogues, hoard limited stock and test stolen cards. This article shows what bot traffic costs a D2C brand in budget, inventory and data quality, why analytics alone misses it, and which layered controls protect spend and stock while keeping real shoppers moving. Growth leads and ecommerce CTOs get the Four-C Bot Defence Loop, Count, Classify, Contain, Claim, with one joint owner across marketing and engineering.
Table of Contents
- What bot traffic is really costing a D2C brand
- The bot types that hit different parts of your P&L
- Why your analytics misses the problem on its own
- The layered controls that protect budget and inventory
- Bot protection for your D2C ecommerce site: the Four-C Bot Defence Loop
- The framework explained
- Why bot defence needs a joint owner in marketing and engineering
- Key takeaways
- The CXO takeaway
Part of the traffic you pay for arrives with zero intent to buy. Bots click your ads, copy your prices and hoard your limited stock, and your analytics counts most of them as visitors.
Quick answer: Bot protection for an ecommerce site matters because bot traffic costs a D2C brand in three places: ad spend wasted on invalid clicks, inventory lost to scalper bots and margin eroded by price scrapers. Imperva’s 2026 Bad Bot Report found automated traffic at 53% of web traffic in 2025, with bad bots at 40%. Measure bot share across ads, product pages and checkout, classify the bot types, layer controls and reclaim spend through platform reports and exclusions.
What bot traffic is really costing a D2C brand
Bots are now the majority of web traffic. Imperva’s report, published by Thales, put automated traffic at 53% of all web traffic in 2025, up from 51% the year before, with bad bots alone at 40%. Your site will differ from the global average. The direction is unmistakable: a meaningful slice of your traffic is automated.
For a D2C brand, the bill lands in three places. Ad budget goes to clicks with zero purchase intent. Limited stock gets hoarded by automated buying and cart-holding. Competitors and resellers scrape prices and product data. Three problems, three owners, one result: eroded margin and distorted numbers.
Ad fraud estimates vary wildly by source, channel and vertical. Treat any single industry figure with caution and measure your own invalid traffic instead. Your data beats an industry average.
Start with a simple audit. Compare ad clicks with sessions, engaged sessions and orders by campaign, and list pages with unusual traffic spikes. Ask engineering which bot controls already run and who reads their reports. If the answer is unclear, the problem is unmanaged.
The bot types that hit different parts of your P&L
Scraper bots copy prices, catalogues and content at high frequency. Competitors use them to undercut you, resellers to list your products elsewhere. The harm is margin and brand control. The signal: heavy product-page traffic with little engagement, and prices you changed an hour ago appearing elsewhere.
Bot types, what they target and the first control
Scalper bots target limited or high-demand stock, buying or reserving faster than any human. The OWASP Automated Threats project names this pattern denial of inventory: real customers hit a sold-out page, and the product resurfaces later at a markup. Launches and festive drops are prime targets.
Click and invalid-traffic bots inflate sessions and ad clicks. They distort conversion rates, pollute retargeting audiences and can steer automated bidding toward junk traffic. Wasted spend and misleading data, in one package.
Other bots attack accounts and payments. Credential stuffers try stolen logins and card testers run tiny payments to validate stolen cards, hitting security, chargebacks and trust. The human attack surface often supplies those stolen credentials. Know which type hits you before you buy a tool.
Why your analytics misses the problem on its own
Standard analytics counts visits. Judging intent needs extra tools. A sophisticated bot that loads a page, scrolls and clicks looks like a session, and ad platforms count the click before any filter sees it. The result: a dashboard showing healthy traffic and weak conversion, and a team blaming the creative.
Look for the pattern across data sources: high clicks with low engaged time, many sessions from one network or device type, spikes at odd hours. Clean Meta Pixel and Conversions API events matter here, because validated events give platforms far better signals than raw page views.
Server-side validation helps. It checks events before they reach ad platforms, so obvious bot traffic stays out of your conversion signals, protecting optimisation as well as reporting. Send platforms only the events you trust.
Add checks at the edge. A web application firewall, rate limits and bot-management tools see requests before analytics does: request rates, device characteristics, behaviour. Read their reports beside marketing data in one review, paired with server-side tracking and CAPI. Two views, one conversation.
The layered controls that protect budget and inventory
Bots adapt, so layer your controls. Rate limits slow request floods, a firewall blocks known bad patterns, challenges test suspicious sessions, and device and behaviour analysis flags automation that slips past simple checks. Apply the strongest checks to the riskiest actions: checkout and login. Friction follows risk.
Protect inventory with purchase rules. Cap quantities per customer on scarce items, set cart-hold timers and use a queue or waiting room for launches, so demand releases at a human pace. Show clear messages when limits apply. A fair rule beats a sold-out page.
Protect ad spend with platform tools and clean signals. Review invalid traffic reports, exclude low-quality placements and sources, and optimise toward validated conversions. Tracking tied to one clear goal reduces the chance of bots training the algorithm. Google’s ad traffic quality resources explain how invalid clicks are detected and credited.
Keep real shoppers moving. Blanket blocks and heavy challenges cost conversion, so test each control against approval and abandonment like any checkout change. Monitor false positives weekly and keep an easy path for anyone blocked in error.
Bot protection for your D2C ecommerce site: the Four-C Bot Defence Loop
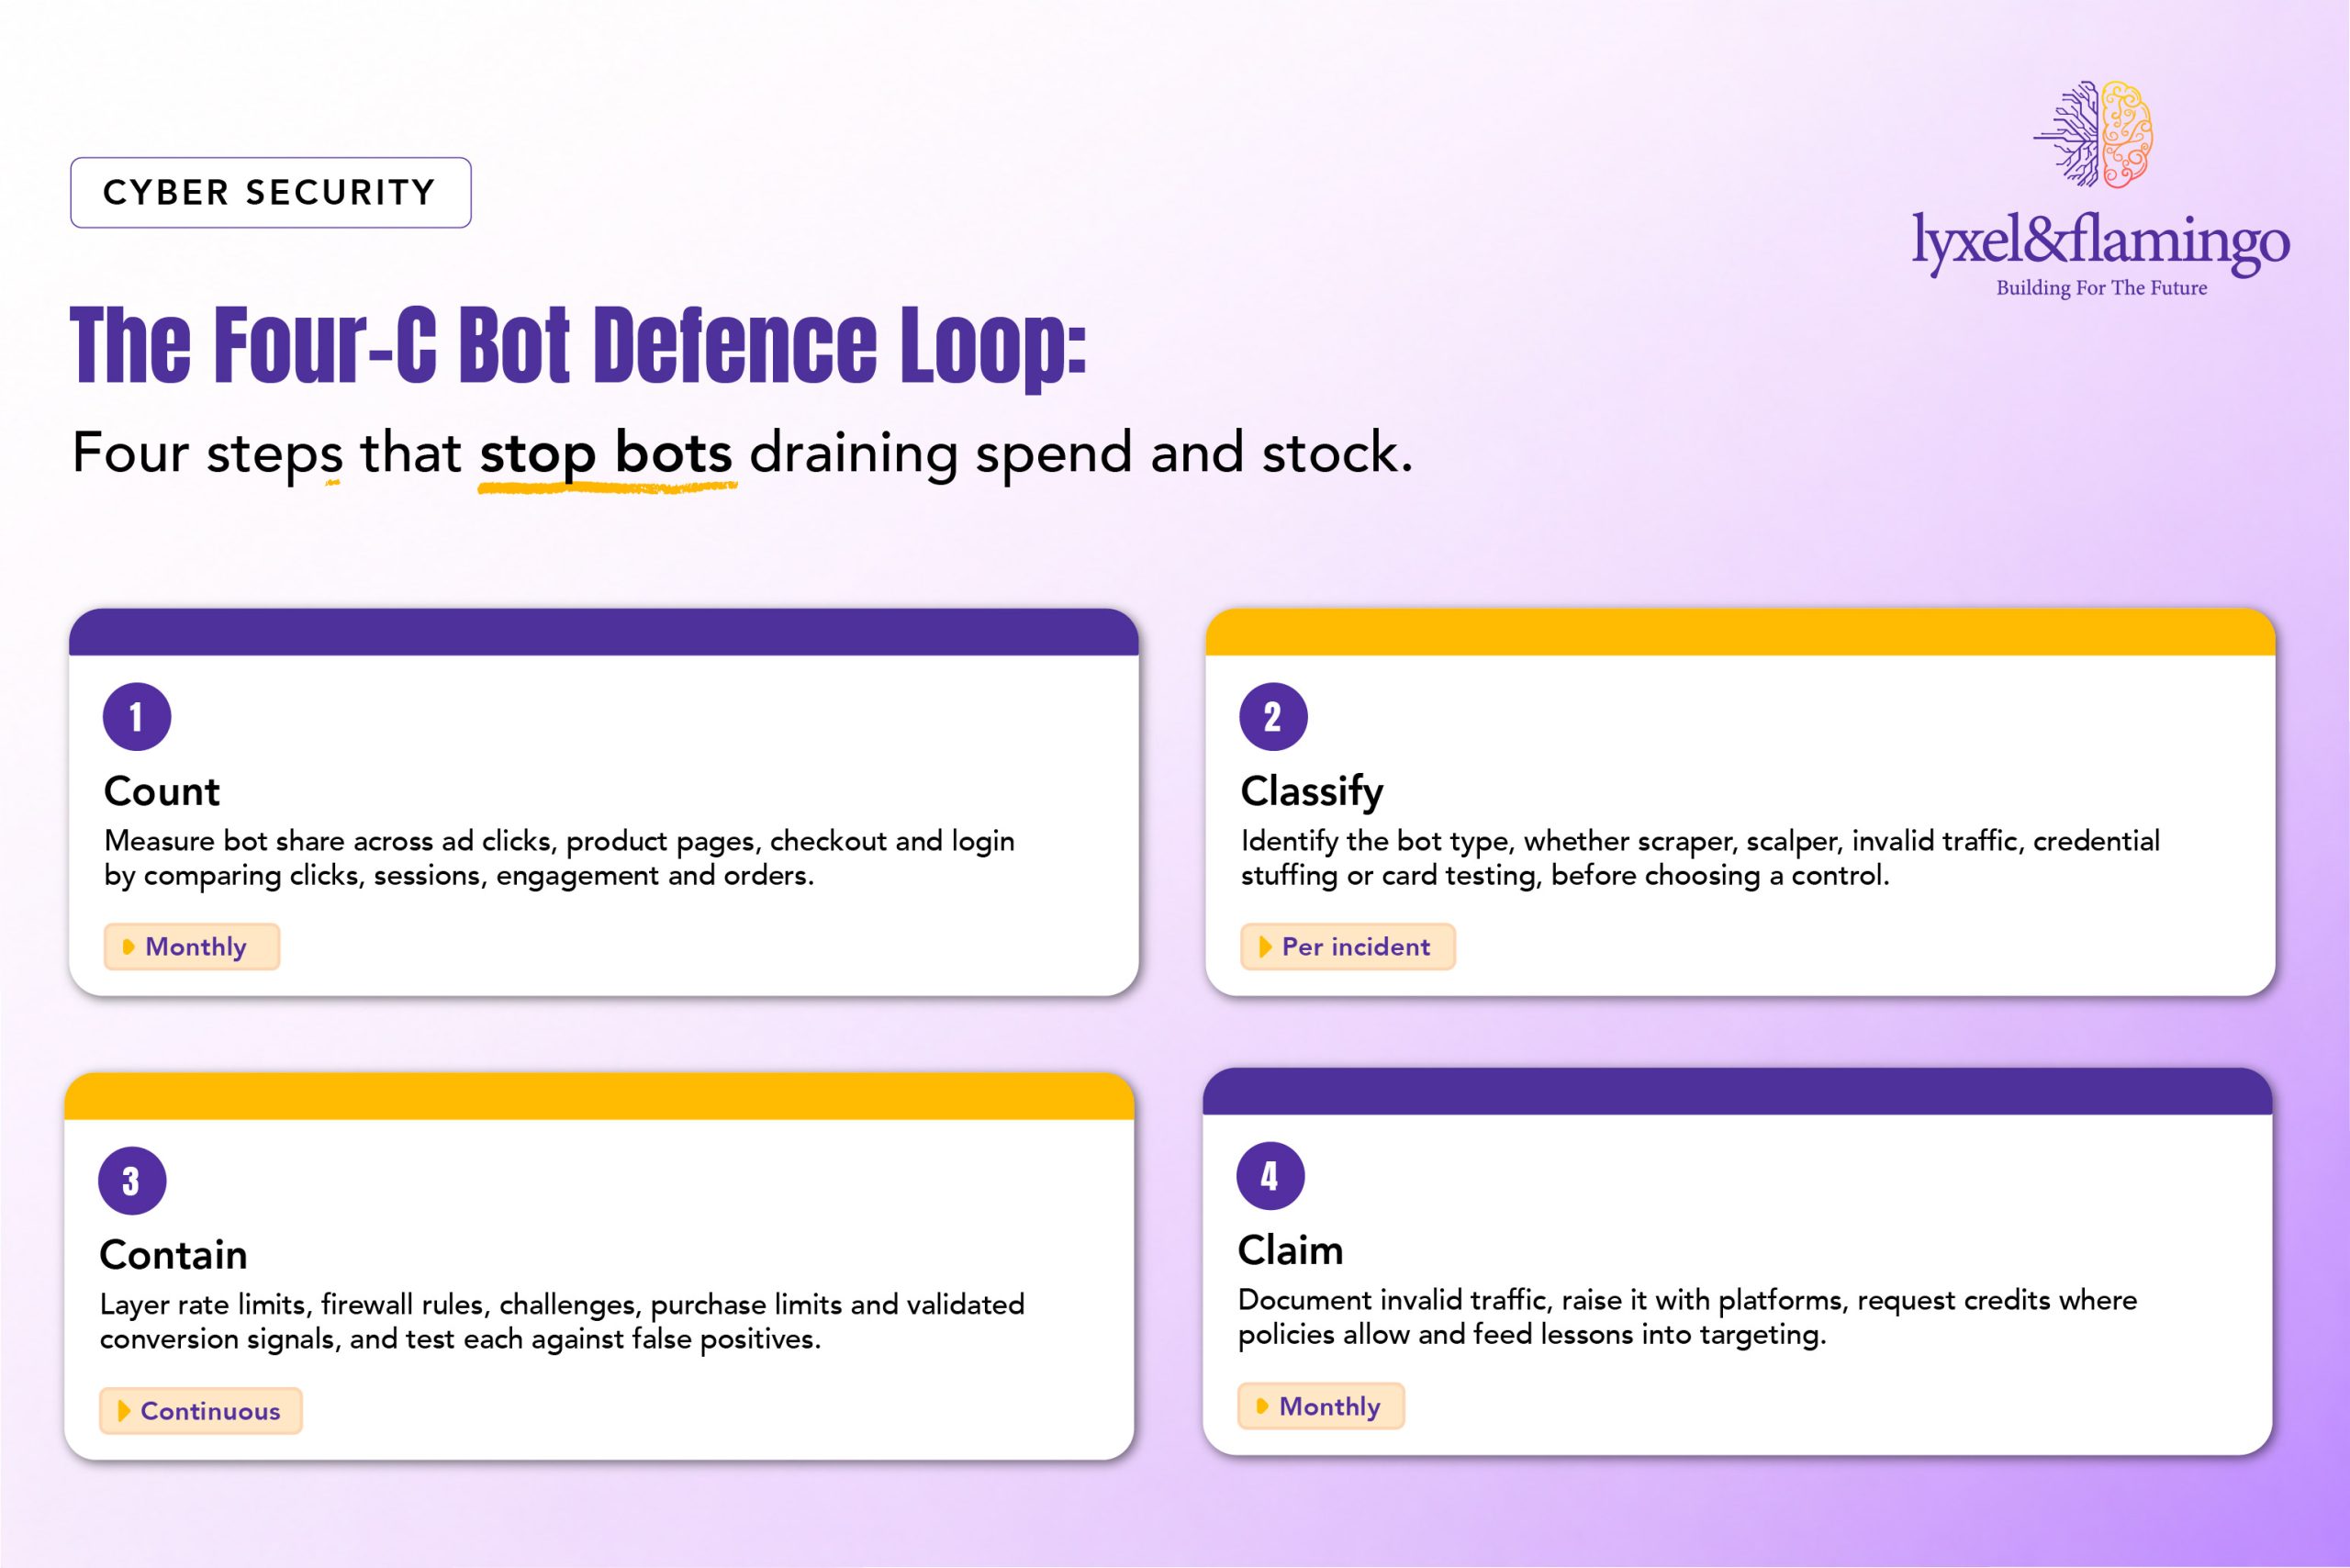
Four steps, repeated, keep bot traffic from quietly draining spend and stock.
The framework explained
Count: Measure before you buy. Each month, compare ad clicks with sessions, engaged sessions and orders by campaign, flag pages with unusual spikes and pull the firewall and bot-management reports. Build a baseline: bot share of traffic, invalid click share and stock lost to automated buying. The baseline tells you whether each control works.
Classify: Name the bot before choosing the cure. Scrapers need rate limits, scalpers need purchase rules and invalid clicks need platform reports and cleaner signals. Record where each shows, who owns it and what it costs.
Contain: Layer controls and test them: rate limits, firewall, challenges for suspicious sessions, purchase limits on scarce items, server-side validation of conversion events. Track approval rate and abandonment for every control, so protection keeps sales flowing.
Claim: Recover what you can and learn from the rest. Document invalid traffic with dates, campaigns and evidence, raise it with platform representatives, request credits where policies allow and exclude bad sources. A monthly claim routine turns losses into evidence, and evidence into rules.
Why bot defence needs a joint owner in marketing and engineering
Bot defence falls between teams. Marketing sees wasted spend and polluted data, engineering sees load and security events, operations sees stock-outs and resale. Everyone owns a piece. The whole needs one owner. Name one accountable owner and make the others formal contributors.
Plan for peaks. Defending ROAS through the festive bidding war shows how bidding and traffic intensify in sale weeks, and bots follow the money. Raise monitoring and limits before the season and agree who can change rules mid-sale.
Give the owner a scorecard. Every KPI is green and your board should still worry makes the case: a healthy-looking dashboard can hide a leak. Track bot share, invalid click share by campaign, stock lost to automated buying, price-scrape events and false-positive blocks. Review monthly with finance.
The Lyxel&Flamingo cybersecurity team works alongside our media and tech teams on exactly this overlap, from website security as a brand asset to fraud prevention at the D2C checkout.
Key takeaways
- Imperva’s 2026 report put automated traffic at 53% of web traffic in 2025, with bad bots at 40%.
- Bots cost a D2C brand in ad spend, limited stock and scraped prices and data. Each needs its own control.
- Analytics alone misses bots. Compare clicks, sessions, engagement and orders, and read firewall reports beside marketing data.
- Layer controls and test each against false positives so real shoppers keep buying.
- Name one owner across marketing and engineering and review a bot scorecard monthly.
The CXO takeaway
Ask your growth lead and engineering lead for one shared page: bot share of traffic, invalid click share by campaign, stock lost to automated buying and the controls currently running. If that page is hard to produce, the problem is unmanaged. Name one accountable owner and fund a baseline measurement before buying any tool. Raise monitoring and purchase limits before every festive season and launch, and review the scorecard with finance monthly.
The question for your next planning meeting: what share of last month’s paid clicks came from something with zero chance of buying from you?
Share your click-to-order data with Lyxel&Flamingo and we will help you build the baseline.
Frequently Asked Questions
It depends on your site, and published figures are global averages. Imperva’s 2026 report put automated traffic at 53% of web traffic in 2025, with bad bots at 40%. Measure your own share by comparing ad clicks, sessions, engaged sessions and orders, and by reading firewall or bot-management reports.
Blunt controls can. Test each control against approval rate and abandonment, reserve stronger checks for risky actions like checkout and login, and monitor false positives weekly. Keep a simple route for anyone blocked in error.
Sometimes. Ad platforms run invalid traffic policies and may credit some invalid clicks, depending on the platform and your evidence. Document invalid traffic with dates, campaigns and data, raise it with your account representative, and focus on preventing the spend in the first place.
Add per-customer purchase limits, cart-hold timers and rate limits on product and checkout pages, and consider a queue for the launch window. Watch stock and cart behaviour in real time with a plan to tighten rules, then review the pattern before the next drop.
Compare the spike with engaged time, pages per session, conversion, orders, source and device mix. A real campaign lifts orders and engaged sessions; bot traffic lifts clicks and sessions with little else. Check firewall logs for request patterns, and pause to investigate before scaling spend.