What this blog covers
What is a good ROAS for D2C brands in India in 2026? The answer depends on your contribution margin, not an industry average. This guide explains how to calculate break-even ROAS, set profitable campaign targets, and measure advertising performance against actual business revenue.
It explores key changes affecting ROAS reporting in 2026, including Meta’s attribution updates and Google’s changes to target-based bidding for budget-limited campaigns. It also explains why platform-reported revenue can differ from delivered revenue after accounting for returns, refused deliveries (RTO), discounts, shipping, and payment gateway fees.
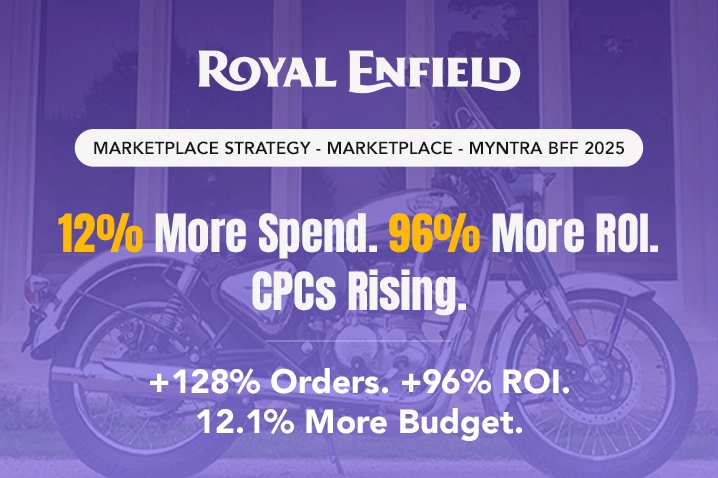
The guide introduces the Margin-Adjusted ROAS Ladder, a four-step framework covering contribution margin, break-even floor, target ROAS, and spending ceiling. A Royal Enfield campaign managed by Lyxel&Flamingo demonstrates how strategic budget reallocation delivered 128% order growth while maintaining 2x ROI.
Discover five practical steps to improve measurement, align marketing targets with finance, and scale campaigns without sacrificing profitability.
Table of Contents
- What Is a Good ROAS for D2C Brands in India?
- There Is No Average ROAS in India Worth Copying
- Three Things Moved Under Your ROAS Report This Year
- The 2026 Research Backs Margin Over Averages
- How to Set a Good ROAS for D2C Brands in India: The Margin-Adjusted ROAS Ladder
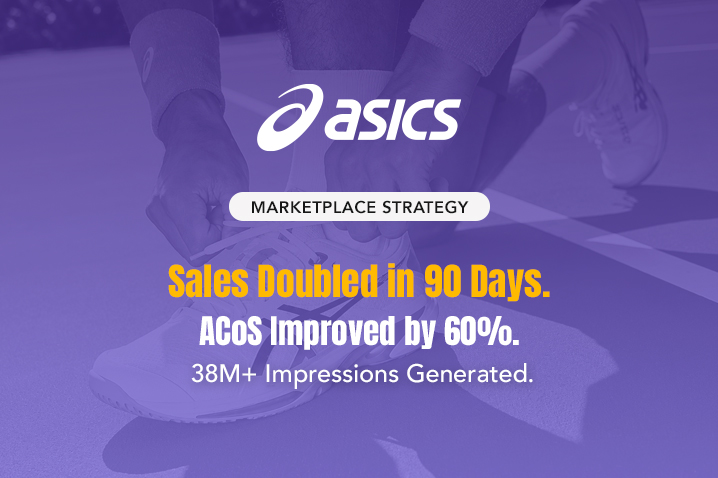
- Royal Enfield Held 2x ROI While Orders Grew 128%
- 5 Things to Do This Quarter Before You Set Another ROAS Target
A 3x ROAS can sink one brand and fund another. A skincare brand keeping 60% of each order after product cost, shipping and returns breaks even at 1.67x, so 3x earns it ₹0.80 per rupee of ad spend before overheads. A consumer electronics brand keeping 30% needs 3.33x to break even, and at 3x it loses 10 paise per rupee. The dashboard shows the same number, the P&L tells opposite stories. So when anyone quotes a good ROAS for D2C brands in India as a single figure, they are guessing at your margin. Our media operations team starts every target from that margin instead.
And the guessing got costlier this year. Meta stopped returning its 7-day and 28-day view attribution windows through the Ads Insights API on 12 January 2026. Google began holding budget-limited Target ROAS and Target CPA campaigns closer to their targets on 17 August. Any benchmark built on data from before those dates followed different rules.
This guide gives you category floors to compare against, then shows how to set a target above your own floor and defend both in front of finance.
What Is a Good ROAS for D2C Brands in India?
People who ask what is a good ROAS usually want a number to copy. The accurate answer is a formula you apply to your own P&L. ROAS, or return on ad spend, is the revenue a campaign generates divided by what you spent on it, so a ROAS of 4 means ₹4 back for every ₹1 spent. Google’s Ads Help treats target ROAS the same way: a 500% target means five units of conversion value for every unit of spend. A good ROAS for ecommerce is one that clears your break-even ROAS, which is 1 divided by your contribution margin, with room left for overheads, returns and growth.
Scale explains why the question matters more now. Bain & Company and Flipkart put India’s e-retail GMV at $65 to 66 billion in 2025, up 19-21% CAGR, with shoppers doubling to 290 to 300 million. More brands chasing those shoppers leaves less room for a wrong target.
There Is No Average ROAS in India Worth Copying
Search for the average ROAS in India and a dozen confident answers appear. We checked the 2026 research from Bain, McKinsey, EY and Gartner for the source behind them. The first three cover India’s online retail, D2C and advertising markets in depth. None of the reports we read gives an average return on ad spend for Indian D2C brands, by category or otherwise.
The numbers that do circulate online come largely from tool vendors and agencies describing their own client accounts. But sample size, category mix and attribution window rarely travel with them. Many ecommerce ROAS benchmarks are one company’s portfolio average wearing a market average’s label.
Meanwhile, the auction underneath those numbers keeps shifting. EY and FICCI report that e-commerce and point-of-sale advertising grew 50% to INR 220 billion in 2025, while Bain puts e-retail GMV growth at 19-21%. Ad revenue in that segment is growing more than twice as fast as e-retail sales, which suggests more ad rupees now chase each order.
Even a clean, audited average would answer the wrong question. It would tell you where other brands landed. Your break-even point depends on your product cost, your shipping bill, your returns rate and how many orders arrive on cash on delivery.
A benchmark records what other brands accepted, and it says nothing about what your margin can afford.
Three Things Moved Under Your ROAS Report This Year
- Meta changed which attribution windows it will report. From 12 January 2026, the Ads Insights API stopped returning the 7-day view and 28-day view attribution windows. Five remain: 1-day click, 7-day click, 28-day click, 1-day engaged view and 1-day view. Meta’s post covers the API only, so check which windows your own dashboards pull. If a 2025 report leaned on a view-through window and a 2026 report does not, the trend line between them compares two different things.
- Google started holding budget-limited campaigns to their targets. On 17 August 2026, Google changed how target-based bidding behaves in campaigns marked “Limited by budget”, so bids now optimise more consistently toward the target. The rollout finished on 27 August and covers Search, Shopping, Performance Max, Demand Gen and Travel. Google does not adjust your targets or budgets for you. It advises anyone who wants to keep current results to update targets to recent performance averages, then wait one to two conversion cycles before judging. Read that advice against your own Floor before acting. If recent performance clears it, matching the target keeps results steady. But if it does not, you have a margin problem, no bidding setting fixes that.
- Platform revenue and delivered revenue drift apart. An ad platform counts the order it sees, while your P&L counts what is delivered, paid for and kept. Bain’s 2026 study notes a shift from cash on delivery to UPI at delivery, so payment still happens at the door. An order refused there keeps counting as platform revenue unless you correct for it.
| What gets counted | Platform ROAS | Contribution ROAS |
| Order value | At purchase | At delivery and payment |
| Returns and refused deliveries (RTO) | Counted unless you correct for them | Deducted |
| Discounts, shipping, gateway fees | Not deducted | Deducted |
| Attribution window | Set by the platform | Not applicable |
Platform ROAS reports what the ad system saw, and contribution ROAS reports what the business kept.
Want to see why brand and performance budgets need one measurement system? Read this blog: The Full-Funnel Media Engine: Why Brand and Performance Are One System
The 2026 Research Backs Margin Over Averages
Four findings from this year’s research explain why we start with margin instead of ecommerce ROAS benchmarks.
- Quick commerce posts eight times higher visit-to-order conversion than traditional e-retail, with lower reliance on cash on delivery. One national average cannot describe both channels.
- Budgets are drifting toward whatever is easiest to tune. Awareness and conversion now take 62.6% of media spend, while loyalty and retention spending fell 29% since 2024, to under 15%. Gartner analyst Ewan McIntyre warns that faster optimisation is not the same as strategy. The sample covers 401 marketing leaders in North America, the UK and Europe, so it signals direction without measuring India.
- D2C adoption is growing nearly three times faster than marketplaces. McKinsey sizes the channel at $10 to 12 billion today and says it could reach $60 billion by 2030. Our read: more D2C brands means more advertisers competing for each first-time buyer.
- Strong CMO-CFO relationships correlate with almost twice the revenue growth of weak ones, yet only 41% of marketers feel equipped to link performance to business outcomes. Bain and Google surveyed 1,397 executives, and the leaders in that group agree on a measurement framework with finance before they allocate budgets.
How to Set a Good ROAS for D2C Brands in India: The Margin-Adjusted ROAS Ladder
The Margin-Adjusted ROAS Ladder has four rungs. Climb them in order, because each rung depends on the one beneath it.
Rung 1, Margin: Work out contribution margin per order before ad spend: revenue after discounts, minus product cost, shipping, payment gateway fees and the losses you expect from returns and RTO. Gross margin only gives you the ceiling on that number, but it shows how far categories spread. In NYU Stern’s January 2026 industry data, US-listed apparel companies keep 56.9% of revenue as gross margin, while food processors keep 23.2%. That spread is the only category benchmark we would put our name to, because it describes a floor, not an average.
| Industry group (US-listed, Jan 2026) | Closest D2C categories (our mapping) | Gross margin | Lowest possible break-even ROAS |
| Apparel | Fashion | 56.88% | 1.76x |
| Household Products | Home care, daily-use goods | 51.04% | 1.96x |
| Electronics (Consumer & Office) | Audio, wearables, gadgets | 38.77% | 2.58x |
| Furn/Home Furnishings | Furniture, decor | 30.28% | 3.30x |
| Food Processing | Packaged food, snacks | 23.23% | 4.30x |
Source: Aswath Damodaran, NYU Stern, margins by sector (US), January 2026. These are US figures, and Electronics covers only eight firms. Indian D2C brands will differ, and shipping, fees and returns only push the real floor higher.
Rung 2, Floor: Break-even ROAS equals 1 divided by contribution margin. Below it, every order loses money before overheads.
Rung 3, Target: Target ROAS equals 1 divided by (contribution margin minus the margin you want to keep after ads). The table below assumes you keep 10% of revenue.
| Contribution margin | Floor (break-even) | Target (keeps 10% after ads) |
| 20% | 5.00x | 10.00x |
| 30% | 3.33x | 5.00x |
| 40% | 2.50x | 3.33x |
| 50% | 2.00x | 2.50x |
| 60% | 1.67x | 2.00x |
| 70% | 1.43x | 1.67x |
The 10% is a planning assumption. Replace it with the margin your own plan needs.
Take an illustrative order of ₹1,200 with ₹420 in product cost, ₹90 in shipping, ₹25 in gateway fees and ₹85 in expected returns and RTO losses. That leaves ₹580, a 48% contribution margin, so the Floor is 2.07x. To keep ₹120 after ads, the Target is 2.61x.
Brands that depend on repeat purchase can run first orders closer to the Floor, but only when cohort data proves the repeat margin repays the gap inside a window you fixed in advance.
Rung 4, Ceiling: The Ceiling is the budget level at which marginal ROAS, the return on your last rupee, drops to your Target. A blended ROAS far above Target usually means you are under-spending or harvesting demand that already existed. Raise spend in steps until the last tranche earns only the Target, and stop there.
Planning to build repeat purchases on quick commerce? Read this blog: Beyond Discounts: How Brands Can Build Visibility and Repeat Purchases on Quick Commerce Platforms
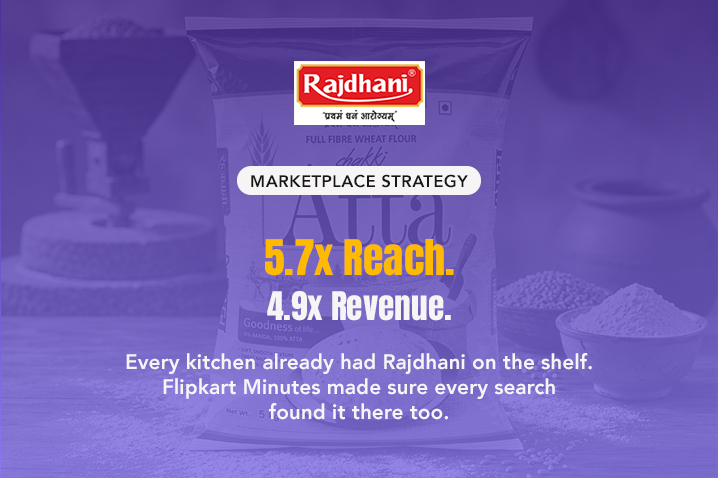
Royal Enfield Held 2x ROI While Orders Grew 128%
-
- The challenge: Royal Enfield wanted more orders at a lower cost per order during Myntra’s Big Fashion Festival, with ROAS held or improved. Two things worked against it: weak audience targeting for a niche lifestyle category, and CPC inflation in a high-traffic sale window.
- The approach: Lyxel&Flamingo’s marketplace team reversed the usual sale playbook. Instead of buying Top-of-Search for every SKU, it kept that placement to high-intent slots and prioritised conversion quality over reach. It mapped incremental spend to placements that already converted, and efficiency metrics, not traffic, decided where each rupee moved. A smarter split of the money already in play, rather than bigger bids.
- The results:
- 128% growth in orders during the festival
- 2x ROAS held even as volume scaled
- 12.1% more budget than baseline, reallocated toward high-converting SKUs
Orders more than doubled on about an eighth more spend, which is what the Ladder predicts when money moves only to placements that already clear the bar.
One caveat matters before you copy anything. This ran on Myntra, a marketplace, not on a brand’s own site. The discipline travels to D2C, and the numbers do not. A second marketplace example points the same way: on a similar investment base, United Colors of Benetton’s Diwali campaign grew ads ROI by about 26% after splitting budget across four performance tiers.
Royal Enfield × Lyxel&Flamingo Third-Party Marketplaces, 2026
Planning your marketplace budgets for the festive window? Read this blog: The Marketplace KPIs Every CXO Should Track During Festive Sales
5 Things to Do This Quarter Before You Set Another ROAS Target
- Calculate contribution margin for your top ten SKUs, not a blended average. Include shipping, gateway fees and your last 90 days of returns and RTO. Margin differs by product, so the Floor does too.
- Write down your Floor and Target before the next campaign launches. Bain and Google found that leading firms agree on metrics with finance before budgets move, then hold them steady while results arrive.
- Re-baseline your attribution settings before you compare any two periods. Use the same window for 2025 and 2026 reports, and check whether your Google targets still match recent performance now that budget-limited campaigns follow them more closely.
- Report two ROAS figures side by side every week: platform and delivered. The gap between them is your leakage from returns, RTO and discounts.
- Track marginal ROAS and new-customer share next to the blended number. If ROAS climbs while new customers shrink, the account is probably harvesting demand it did not create.
Conclusion
Platforms will change their reporting again before next festive season, as they always do. The brands that hold their footing will be the ones whose targets come from their own P&L, because that arithmetic does not move when a dashboard does. That makes your Floor a better planning input than any D2C marketing benchmarks deck.
So here is the question for your next budget review: if finance asked you today to defend your ROAS target with a number from your books, could you? If the answer is no, start there.
Bring your last 90 days of platform-reported and delivered revenue to our media operations team, and we will work out your Floor and Target with you.
Frequently Asked Questions
There is no universal figure, because a good ROAS for ecommerce is any number above your break-even ROAS (1 divided by contribution margin) with a buffer for overheads and growth. That means above 3.33x at a 30% margin and 2x at 50%.
No audited national average exists, and the 2026 reports from Bain, McKinsey, EY and Gartner that we read do not publish one. Derive a floor from your own margin instead.
It depends entirely on your margin: at a 25% contribution margin, 4x is exactly break-even, while at 50% it is double break-even.
Platforms count orders inside an attribution window, before returns and RTO, while your books count delivered and paid revenue. Meta also dropped its 7-day and 28-day view windows from the Ads Insights API on 12 January 2026, so compare matching windows only.
Reset it whenever your margin moves, such as new shipping rates, deeper discounts or a higher RTO rate, and after major platform changes such as Google's August 2026 target-bidding update. Review it at least once a quarter.