What this blog covers
Marketplace margin erosion on Amazon and Flipkart almost never shows up as one dramatic line item. It builds from commission and referral fees, ad spend creep, returns, and storage costs stacking on top of each other while the topline still looks healthy. This piece breaks down where marketplace margin actually goes and lays out a contribution margin model built to catch the leak before the annual review does.
Quick Answer: Marketplace margin on Amazon and Flipkart is typically eroded by five factors: referral and commission fees (usually 8 to 20% depending on category), advertising spend that creeps upward faster than sales, returns and reverse logistics costs that land weeks after the sale, storage and long-term storage fees on slow-moving SKUs, and unplanned discounting during sale events. A true contribution margin model nets out all five at the SKU level, rather than relying on a single blended ACOS or revenue number.
Table of Contents
- The Five Silent Margin Killers Nobody Puts in the Sale Recap
- Commission and Referral Fees: The Line Everyone Underestimates
- Ad Spend Creep: When ACOS Looks Fine, Blended Margin Doesn’t
- Returns and Reverse Logistics: The Cost That Arrives Weeks Later
- Storage Fees and the SKUs Quietly Losing Money Every Month
- Building a True Contribution Margin Model
- Key Takeaways
- CXO Takeaway
The Five Silent Margin Killers Nobody Puts in the Sale Recap
Most marketplace P&L reviews start and end with revenue and ACOS, which is exactly why margin erosion goes unnoticed for so long. Revenue can grow 20% year over year while contribution margin per unit quietly falls, because the costs eating into that margin, commissions, ad spend, returns, storage, sit in different reports owned by different teams.
No single team is lying about their number. Finance reports commission accurately. Performance marketing reports ACOS accurately. Operations reports return rate accurately. None of them, on their own, shows the combined effect on what a brand actually keeps per unit sold, which is the number that should be driving pricing and promotion decisions.
Commission and Referral Fees: The Line Everyone Underestimates
Amazon and Flipkart referral fees range from roughly 5% to over 20% depending on category, and they apply to the full selling price, not the margin left after cost of goods. Amazon’s own seller fee schedule is worth checking directly against category assumptions, since fee structures are published and updated by the platform itself, not estimated by the brand. A brand selling at a 40% gross margin can lose half of that margin to referral fees alone before any advertising or fulfillment cost is even counted.
Category reclassification is a common, quiet source of fee creep. A SKU that gets recategorized by the platform, sometimes without an obvious notification, can shift from an 8% referral fee bracket to a 15% one overnight, and unless someone is auditing fee statements at the SKU level, that change can sit unnoticed for months. Flipkart’s Seller Hub fee and commission structure carries the equivalent commission and fee information for brands running the same reconciliation on that platform, and the two fee schedules are worth checking side by side rather than assuming parity.
Ad Spend Creep: When ACOS Looks Fine, Blended Margin Doesn’t
ACOS holding steady at a healthy-looking 15% can still coexist with declining margin, because ACOS measures ad efficiency relative to ad-attributed sales, not overall profitability. As competition intensifies, especially heading into festive windows, brands often need higher absolute spend just to defend the same ACOS, which eats into total contribution margin even while the ratio looks unchanged.
The shift toward retail media networks across marketplaces means more of the historically organic funnel now carries a media cost, which is part of why blended margin needs its own tracking separate from platform-reported ad metrics.
Defensive spend, the budget spent purely to protect Buy Box or branded search position against competitors, deserves its own line item. It rarely drives incremental sales, yet it is real spend that erodes margin every single month it runs.
Returns and Reverse Logistics: The Cost That Arrives Weeks Later
Returns on marketplaces carry a cost far beyond the refunded sale price. Reverse shipping, restocking or disposal, and the lost selling window while a returned unit is out of saleable inventory all add up, and fashion and footwear categories can see return rates well above 20% during and after sale events.
Because returns typically land two to four weeks after the original sale, they rarely get netted against the campaign or sale event that drove them. A festive sale that looked profitable in the week-one recap can look considerably less so once the return wave fully lands, which is exactly why margin reconciliation needs a delay built into it.
Storage Fees and the SKUs Quietly Losing Money Every Month
Long-term storage fees on slow-moving inventory are one of the easiest costs to overlook because they charge monthly, in small amounts, on SKUs that already feel forgotten. A single unit sitting in a fulfillment center for six months can accumulate storage charges that exceed its entire margin, turning a technically profitable sale into a net loss once storage is factored in.
This is also where inventory and margin strategy intersect directly with festive planning, since overstocking ahead of a sale to avoid stockouts carries its own storage cost if demand forecasts run high. Our festive season inventory and Buy Box strategy guide covers how to balance that trade-off without starving high-velocity SKUs of stock.
Building a True Contribution Margin Model
A contribution margin model that actually protects profitability needs to net out referral fees, ad spend, an estimated return provision, and storage cost at the SKU level, updated at least monthly. Building it at the SKU level rather than the category or brand level matters, since margin erosion is rarely uniform. A handful of SKUs are often responsible for most of the damage while the rest of the catalog performs fine.
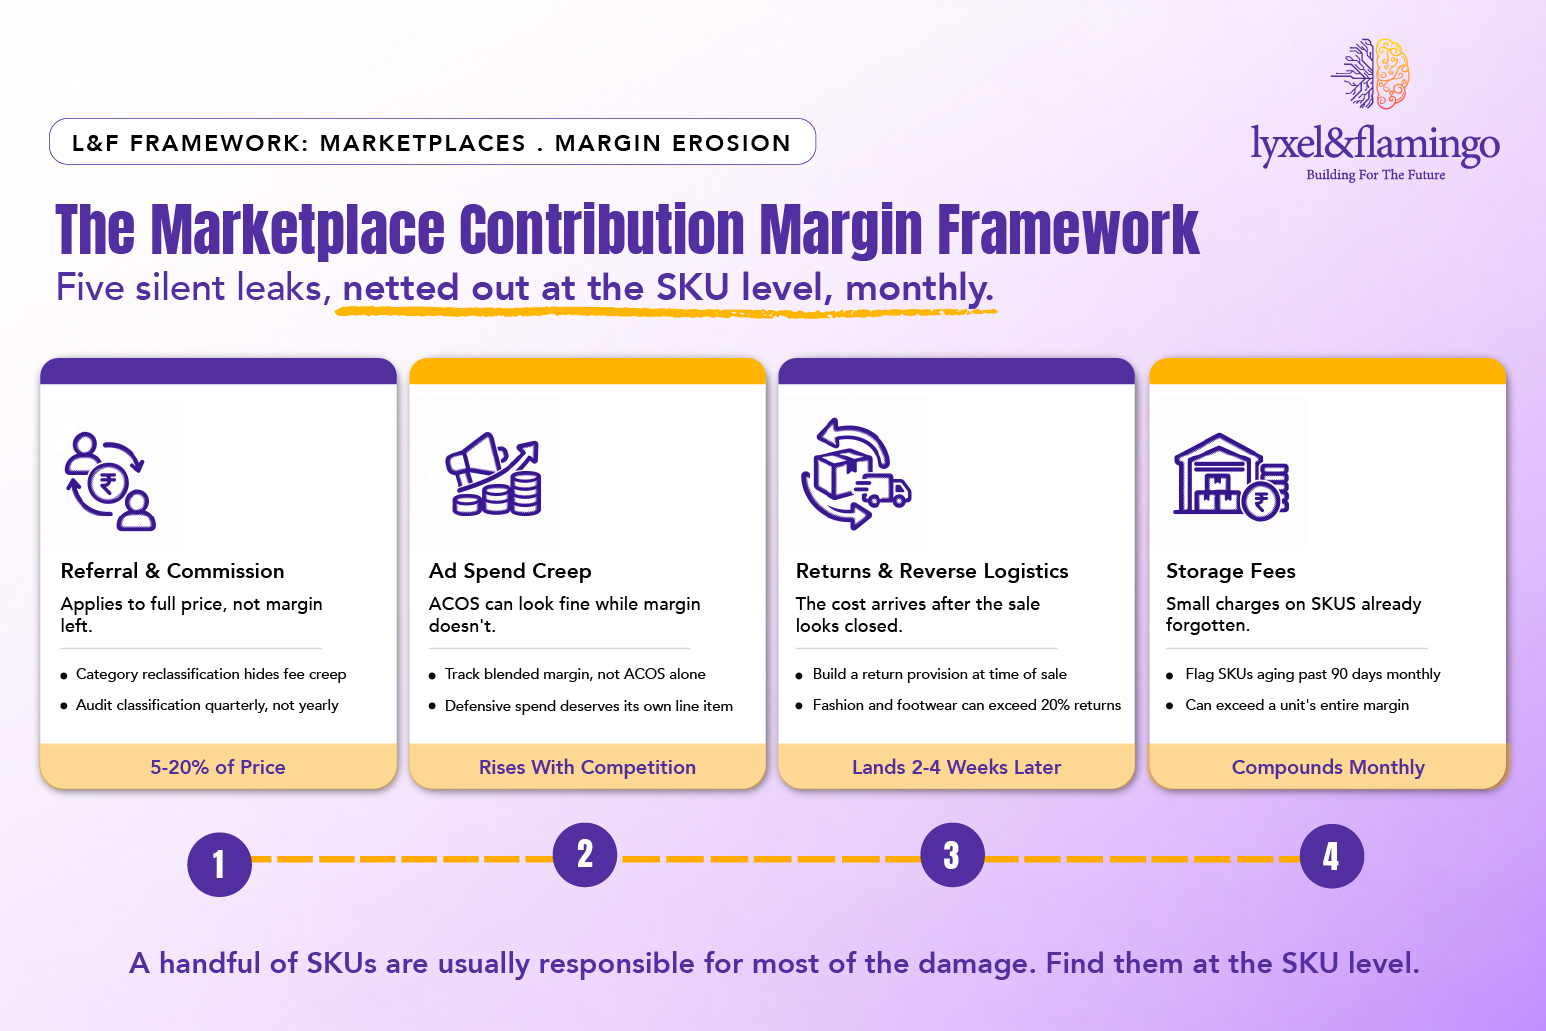
Framework Explained
Referral and Commission Fees: These apply to the full selling price, not margin, so even a small category reclassification can meaningfully change unit economics.
Advertising Spend: This needs to be tracked as blended margin impact, not just ACOS, since a stable ratio can still hide rising absolute cost.
Returns and Reverse Logistics: These should be built into the margin model as a provision at the time of sale, not reconciled only after the fact.
Storage Fees: These reward a monthly SKU-level aging review, since a handful of slow movers usually account for most of the hidden cost.
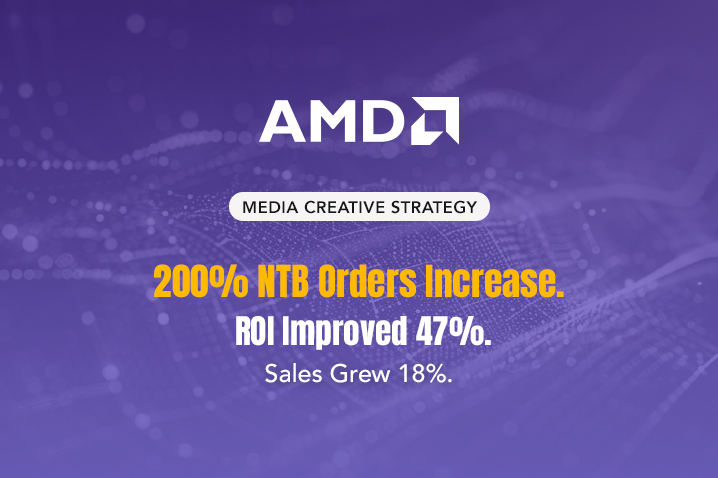
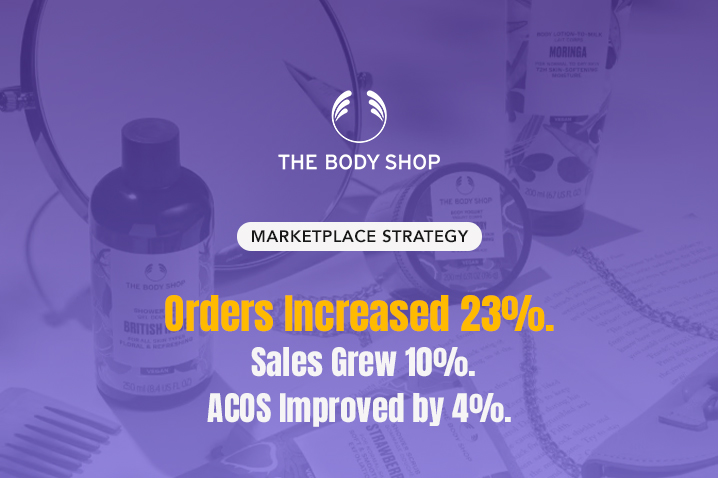
✓ CLIENT PROOF POINT The Body Shop needed to grow its Amazon presence without letting ad inefficiency erode margin further in a competitive cosmetics category. By defending owned ASINs and keywords, concentrating spend on top-performing categories, and systematically adding negative keywords to cut wasted spend, the brand cut ACOS by 4%, grew sales by 10%, and increased orders by 23%. Read the full Body Shop case study. AMD’s marketplace performance work and Godrej Appliances’ Amazon display campaign show the same margin-first discipline applied to very different category economics, electronics and large appliances, where ad spend creep and storage costs compound in their own specific ways.
Key Takeaways
- Marketplace margin erosion rarely comes from one cause; it compounds from fees, ad spend, returns, and storage all at once.
- Referral fees apply to full selling price, and category reclassification can quietly shift a SKU into a higher fee bracket.
- ACOS can look stable while blended contribution margin declines, especially as competitive ad spend rises.
- Returns typically land weeks after the sale, so margin reconciliation needs to build in that delay rather than reporting too early.
- A SKU-level contribution margin model, reviewed monthly, catches the handful of products doing most of the damage.
CXO Takeaway
If you netted out fees, ad spend, returns, and storage today, which SKUs would still be profitable? Most marketplace P&Ls answer that question only once a year, by which point the damage has already shaped a full season of decisions. A monthly, SKU-level contribution margin view turns that into a decision leadership can act on in real time. Lyxel&Flamingo’s third-party marketplace team builds exactly that kind of margin visibility for brands scaling across Amazon and Flipkart.
Frequently Asked Questions
It varies by category. Returns and ad spend creep together usually account for more erosion than commission fees alone, mainly because they are the two most likely to be tracked separately rather than netted together.
ACOS measures ad efficiency against ad-attributed sales only. Rising absolute spend needed to defend that same efficiency ratio, plus fees, returns, and storage sitting outside that metric entirely, can all erode margin without ACOS ever moving.
Monthly at the SKU level is the practical minimum, with an added return provision built in at the time of sale rather than waiting for actual returns to land weeks later.
Yes, especially for slow-moving SKUs. Long-term storage charges compound monthly and can exceed a unit’s entire margin well before it finally sells or gets liquidated.