
What this blog covers
A repeatable, scoreable method for finding exactly where an experience loses users – not by guessing, but by systematically auditing five distinct kinds of friction. Where the full-funnel CRO view sets the strategy, the friction audit is the hands-on technique a team can run this month to find the specific leaks costing the most.
Table of Contents
Friction, defined: the tax users pay to do business with you
Friction is any effort, confusion, or hesitation an interface imposes between a user’s intention and its completion. It is the tax a user pays to do business with you, and like any tax, the higher it is, the fewer people are willing to pay it. Friction is rarely one big obstacle; it is the accumulation of small ones – a field too many, a step that could have been removed, a moment of doubt with no reassurance nearby. Each seems trivial in isolation, which is exactly why it survives. The friction audit exists to make that accumulation visible and measurable, so it can be removed deliberately rather than tolerated by default.
Why friction is invisible to the people who built it
The people closest to a product are the least able to see its friction, because they have internalised every step. The five-field form is obvious to the team that knows why each field exists; the confusing navigation is clear to the people who designed the taxonomy; the slow-loading page is invisible on the fast office connection. Meanwhile the evidence of what friction costs is unambiguous: the Baymard Institute finds that 47% of cart abandonments are caused by unexpected costs, and 70.19% of carts are abandoned on average (2024) – much of it friction the business could not see. And speed friction alone is measurable in revenue: a 0.1-second improvement in mobile load raises conversions by 8.4% (Deloitte/Google, 2020). A friction audit is how a team escapes its own blind spot and sees the experience as a first-time user does.
The five kinds of friction
- Cognitive friction. The mental effort of understanding what to do – too many choices, unclear language, competing calls to action, a value proposition that takes work to grasp.
- Form friction. Every field, step and required decision in a form or checkout – especially the ones collected for the business’s convenience rather than the user’s progress.
- Navigation friction. The effort of finding the right thing – a taxonomy built around the org chart, weak search, buried key pages, dead ends.
- Payment friction. Everything between “I want this” and “I have paid” – limited payment options, surprise costs, forced account creation, a flow with no recovery from failure.
- Performance friction. Slow loads, jank, and instability – the friction users feel before they have consciously registered anything at all.
Framework: The Friction Audit
The method: instrument the funnel, locate the biggest drop-offs, classify the friction at each into these five types, score each by impact and effort, then remove and re-measure. It is a loop, run on a cadence, not a one-time cleanup.
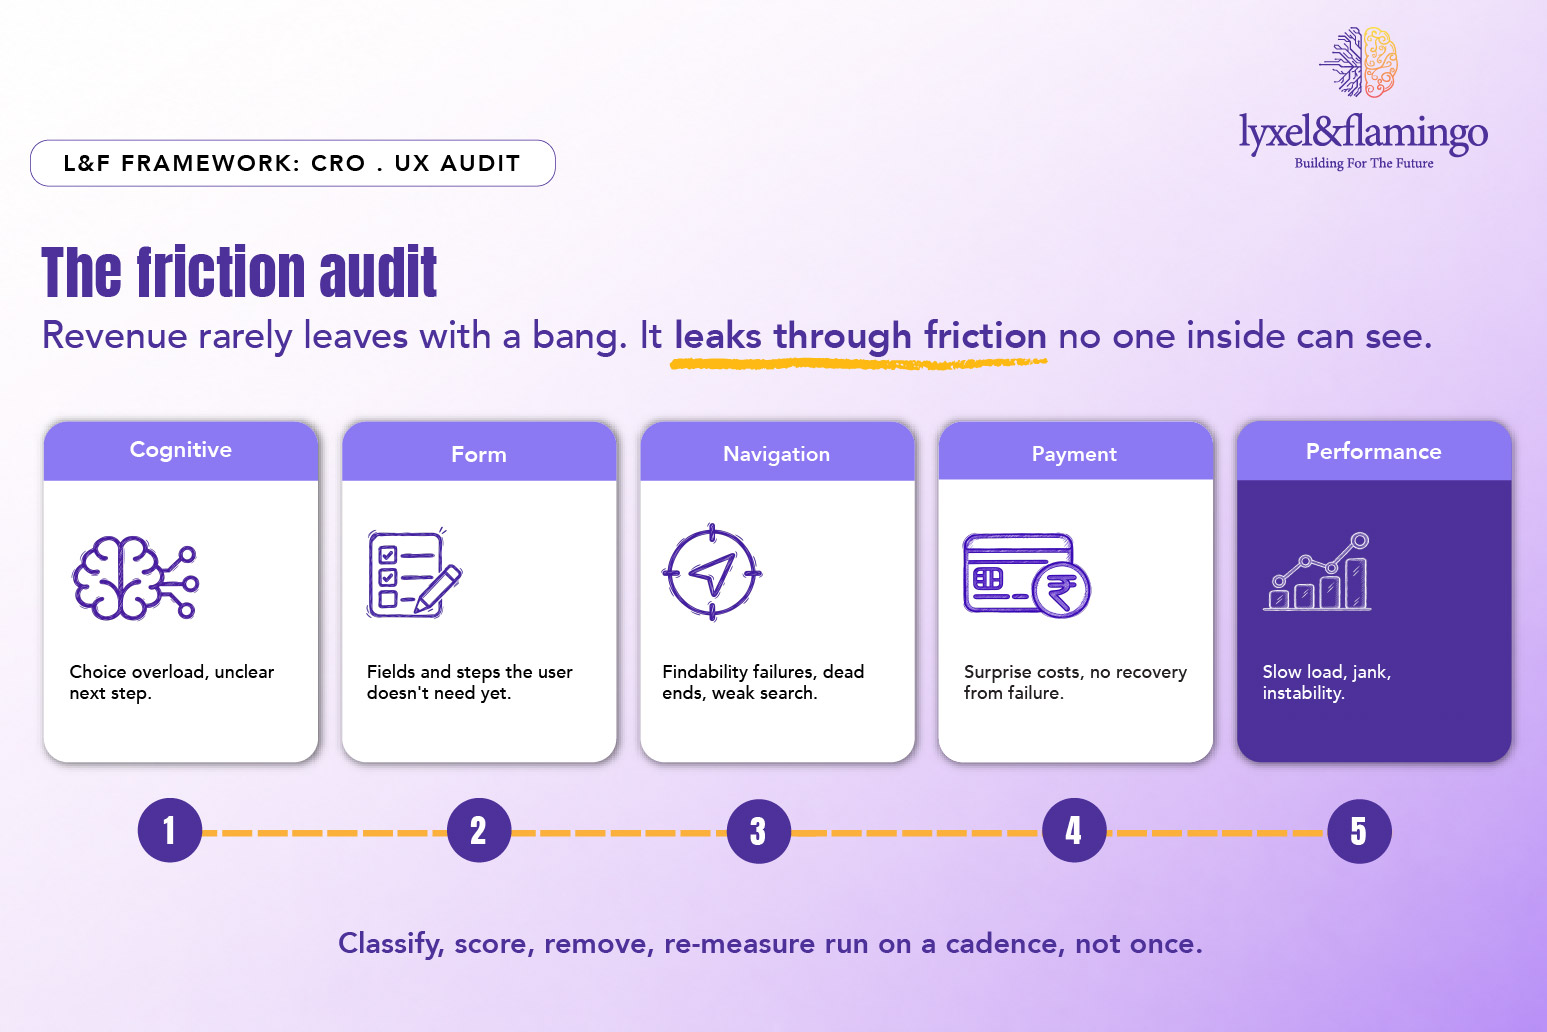
The Framework explained
Cognitive friction: Is the effort of thinking, and it is the friction teams most often mistake for a design preference. It shows up as choice overload – three calls to action where there should be one – as language that describes the business rather than the user’s need, and as pages that take work to understand. The signals are behavioural: high bounce despite relevant traffic, shallow scrolling, and rage clicks where users tap repeatedly at something that is not responding as expected. Reducing cognitive friction usually means removing, not adding: fewer choices, clearer words, one obvious next step.
Form friction: Is the most quantifiable kind, because every field and step can be counted and every abandonment measured. The audit asks a hard question of each field: does the user need this to progress, or does the business want it for later convenience? Fields collected “while we have them” are pure friction, paid for in abandonment. Field-level analytics show exactly where users give up, which makes form friction both the easiest to measure and often the highest-return to fix.
Navigation friction: Is the effort of finding, and it is frequently the largest hidden leak because it happens before the funnel a team usually watches. When navigation is built around how the business is organised rather than how customers think, users loop, hit dead ends, and exit from the very pages meant to route them onward. This is exactly the failure L&F found on the Biotique rebuild, where a wide, expert product range was made to “feel like a wall” by navigation that did not match how skincare customers actually browse – and rebuilding it around real behaviour is what opened the range to exploration.
Payment friction: Sits at the most expensive point in the journey, because the users who reach it have already decided to buy. Baymard’s finding that nearly half of abandonment is caused by unexpected costs is the definitive statement of this friction: fees that appear late, a required account, a missing payment method, or a flow that freezes with no way to recover. This is as much a trust issue as a mechanics issue, and it is why a genuinely high-performing storefront treats the last few steps as sacred ground where every avoidable obstacle is removed.
Performance friction: Is the friction users feel first and attribute last. A slow or unstable page is experienced as a vague reluctance to continue long before anyone consciously blames the load time, and because it is invisible on the fast connections the team uses, it is systematically under-diagnosed. Core Web Vitals and real-device testing are how it is surfaced, and the Deloitte/Google finding makes the case for fixing it in the only language that reliably moves priorities: revenue. Performance belongs on the CXO’s web-ROI ledger, not buried in an engineering backlog.
Real-world scenario: Subway India
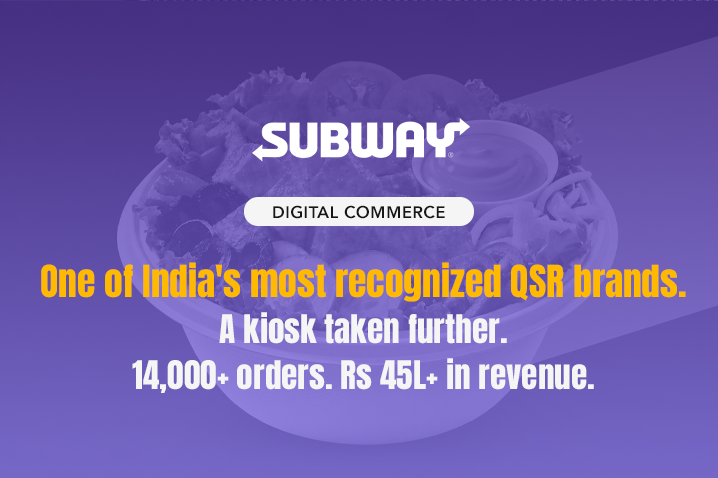
Subway India is a near-perfect case study in friction, because the friction was not in the branding or the menu – it was in the system. The self-service ordering kiosk had everything in place on the surface: screens, menus, payment hardware. Underneath, it was built around system logic rather than customer behaviour, and the friction was everywhere it mattered. Ordering took eight or nine steps, creating decision fatigue before a customer reached payment. The layout was designed for the wrong screen. Payments froze with no instant cancel or retry, so staff had to step in and the queue – the very thing self-service exists to avoid – grew.
The rebuild was, in effect, a friction audit executed end to end. Form and cognitive friction were attacked by cutting the ordering journey from eight or nine steps to four or five – a 50% reduction – through guided product building and the elimination of redundant steps. Payment friction was removed by rebuilding the payment layer for failure as well as success, with instant cancel and retry so a frozen transaction no longer stranded the customer. Performance friction was addressed with a stack built to hold under real transaction volume. The results speak to what removing friction is worth: across its first 17 stores the rebuilt kiosk generated 45 lakh in orders and processed more than 14,000 transactions, with the crashes and payment freezes that had defined the old experience eliminated. The same customization that had been turning into a queue became the thing that kept customers moving – because the friction between intention and completion had been systematically removed.
Going deeper: scoring and prioritising
Turn the audit into an action plan:
- Instrument the funnel so drop-off is visible at every step
- Locate the three largest drop-off points by volume and value
- Classify the friction at each into the five types (cognitive, form, navigation, payment, performance)
- Score each issue by impact (revenue at stake) and effort (cost to fix)
- Prioritise high-impact, low-effort fixes first – the quick wins that fund the rest
- Remove the friction and re-measure against the same funnel step
- Re-run the audit on a cadence; friction re-accumulates as the product changes
Key takeaways
- Most lost revenue leaks through accumulated small frictions, not dramatic failures.
- Friction is invisible to the people who built the product, which is why a systematic audit beats intuition.
- The five friction types – cognitive, form, navigation, payment, performance – give a complete, classifiable map of where experiences leak.
- The method is a loop: instrument, locate, classify, score, remove, re-measure – run on a cadence, not once.
- Subway India shows the payoff: cutting ordering steps 50% and rebuilding the payment layer produced 45 lakh in orders and 14,000+ transactions across 17 stores.
The CXO takeaway
For a CXO, the friction audit is attractive because it converts a vague ambition – “improve conversion” – into a concrete, prioritised list of revenue leaks ranked by impact and effort. It needs no redesign to begin and no new traffic to pay off; it recovers value from users the business has already acquired and is currently losing to obstacles no one on the inside can see. The discipline is to run it as a recurring method rather than a one-time cleanup, because friction re-accumulates every time a well-meaning team adds a field, a step, or a feature. The organisations that make the friction audit a habit are the ones whose conversion rate quietly climbs while their competitors keep buying more traffic to pour into a leaking funnel.
Frequently Asked Questions
Full-funnel CRO is the strategic system for optimising the whole journey; the friction audit is a specific, hands-on method within it for finding and removing the concrete obstacles at each stage. One sets direction, the other does the finding.
No. Funnel analytics, session recordings or heatmaps, field-level form analytics and Core Web Vitals cover most of it. The discipline of classifying and scoring matters more than expensive tools.
It varies, but navigation and form friction are the most commonly underestimated, because they sit before or around the checkout that teams tend to watch most closely. The audit exists precisely to stop you guessing.
On a cadence - quarterly for high-traffic commercial journeys - and after any significant change, because every addition risks reintroducing friction that a previous audit removed.
You can begin with expert review and session recordings, but the highest-confidence version needs the funnel instrumented so drop-off is measurable. Getting measurement in place is usually the first recommendation the audit produces.