
What this blog covers
The metrics most marketers report to the board are lagging: they confirm what already happened. The signals that actually predict growth are the ones almost nobody watches. This whitepaper explains why a high ROAS can coincide with a flat business, introduces L&F’s operating model: the 4-S Signal Funnel (Salience, Signal, Sale, Stickiness), and details, stage by stage, the leading indicators that let you read a campaign before the revenue line agrees. It closes with the measurement ‘plumbing’ that makes it all trustworthy, a leadership scorecard, real client proof, and a set of FAQs.
Table of Contents
- The Dashboard Rewards the Wrong Campaign
- Lagging KPIs Report the Past; Leading KPIs Predict the Future
- The 4-S Signal Funnel Framework
- The AI Shift: Creative Is the New Targeting
- The Plumbing: Attribution and Event Tagging
- The India Layer: Click-to-WhatsApp and Phygital
- The Proof: What the Signals Delivered
- The Leadership Scorecard and Self-Check
- Key Takeaways
- Closing
The Dashboard Rewards the Wrong Campaign
The most dangerous slide in any media review is the one where ROAS is up and the business is flat. We have sat in rooms where a campaign was killed for a ‘falling’ ROAS while it was quietly building the brand’s biggest quarter in three years, and watched teams celebrate a 9X ROAS that was, in truth, nothing more than last-click harvesting of demand the brand already had. In both cases the dashboard was confident. In both cases it was pointing at the wrong thing.
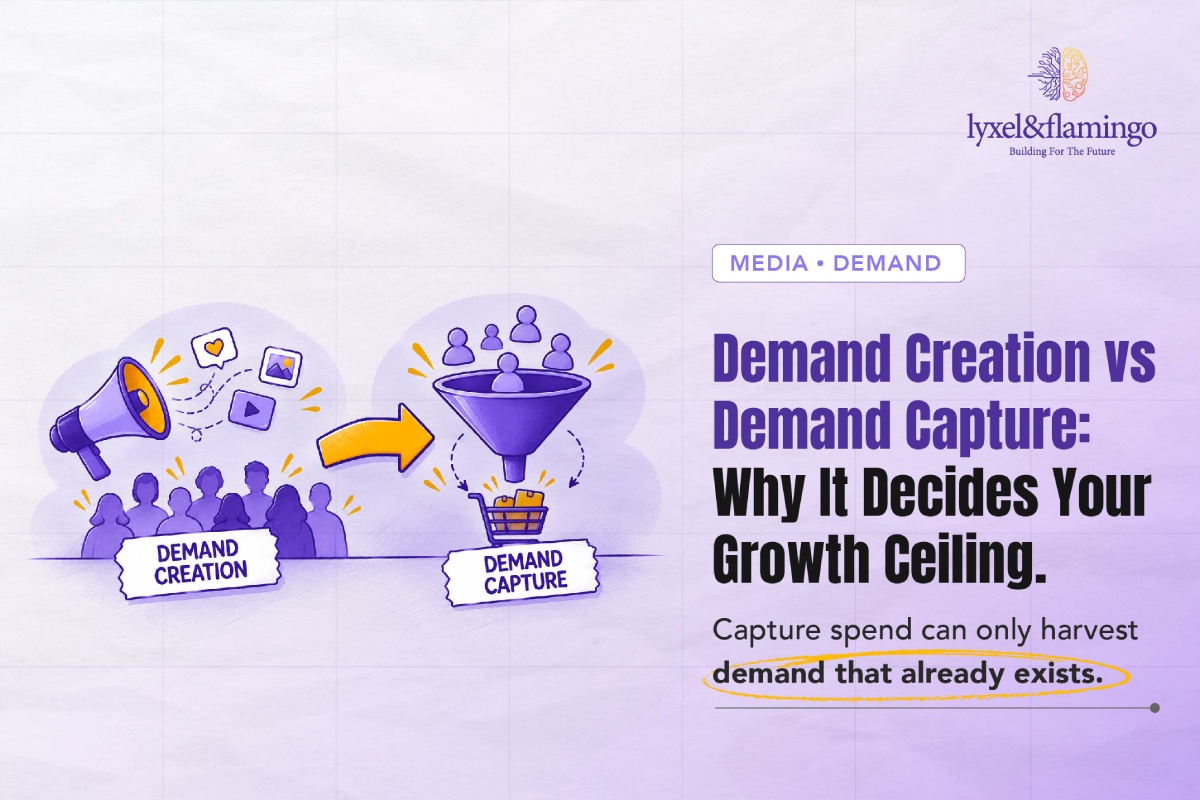
The cause is structural. Consumer brands have industrialised performance marketing: every rupee is tracked, every campaign has a ROAS, and the festive quarter turns the whole system up to eleven. But most of what gets reported upward is lagging: it records outcomes after the decisions that caused them. The result is a strange inversion: the bottom-funnel campaign that harvests existing demand looks like a hero because last-click hands it the sale, while the upper-funnel work that actually created that demand looks like a cost centre, because its impact shows up somewhere the ROAS column cannot see. Cut the second to feed the first, and you get a great-looking dashboard attached to a business that slowly stops growing.
This is, at heart, a measurement problem wearing a performance costume, which is why the fix starts with how you measure media, not with a new channel.
Lagging KPIs Report the Past; Leading KPIs Predict the Future
The fix is not more dashboards. It is watching a different set of numbers, the ones that move before revenue does.
The most reliable early signal is branded search volume. When your upper-funnel work lands, people stop searching the category and start searching for you by name. It is the closest thing performance marketing has to a leading indicator of incrementality, and it shows up weeks before the revenue line reacts. Across full-funnel programmes we have run, a clean uptick in branded search has preceded every durable jump in revenue.
The other leading signals travel in the same pack: video view rate (a 55% view rate against a 37-42% norm is the leading edge of consideration), direct and organic traffic (the demand you created surfaces here first), and the one most teams ignore: cost-per-result stability while scaling. Anyone can be efficient at small spend; holding cost per result nearly flat while you double volume is the truest sign that the engine is healthy rather than lucky.
The evidence against the split is now overwhelming. Advertising works by moving people from exposure to memory to sale over time, not in a single click (Nielsen), and long-run profit is maximised when brand-building and activation are held in balance rather than collapsed into pure harvesting – the basis of the 60/40 rule (IPA (Binet & Field)). Most categories also have far more future buyers than in-market ones, so a plan that only speaks to people ready to buy today ignores the majority of its market (Ehrenberg-Bass). The split does not just under-serve the brand; it structurally under-serves growth.
The Evidence backs the reframe. Advertising works by moving people from exposure to memory to sale over time, not in a single click (Nielsen), and profit is maximised when brand-building and activation are held in balance rather than collapsed into pure harvesting (IPA (Binet & Field)).. A plan that optimises only the last step slowly starves its own growth.
The 4-S Signal Funnel Framework
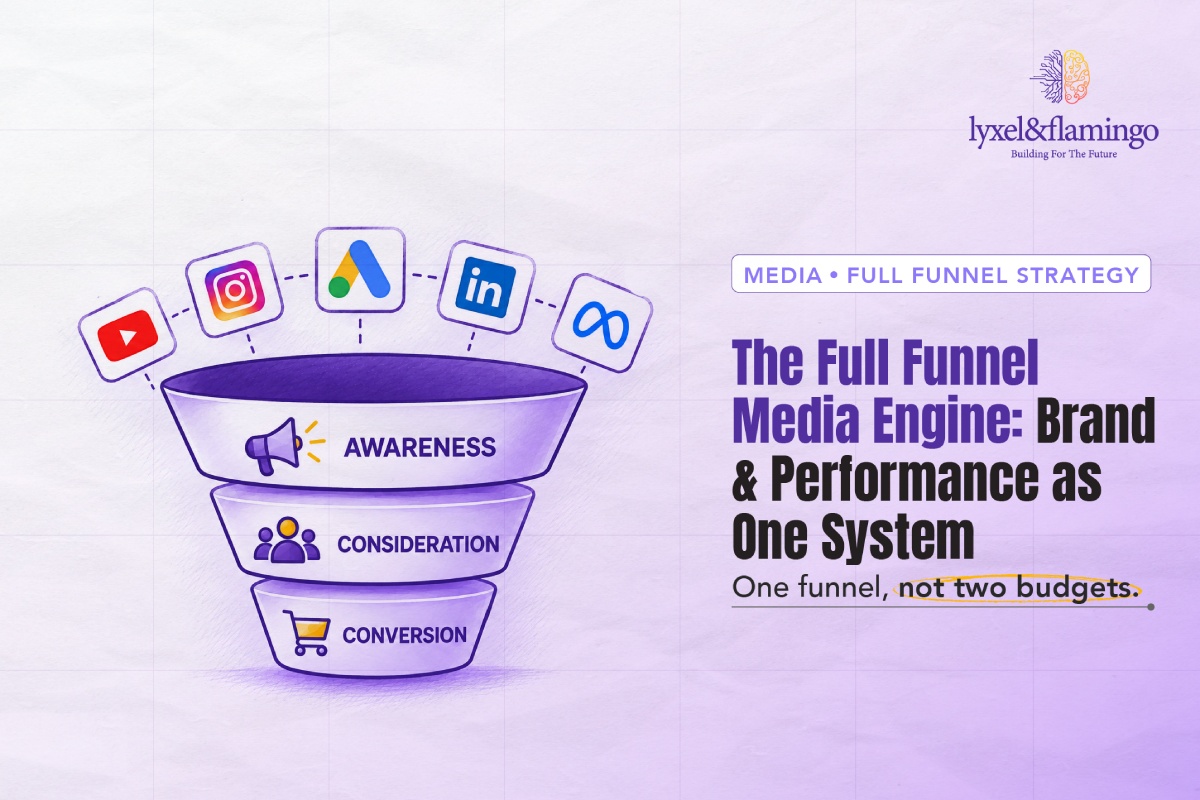
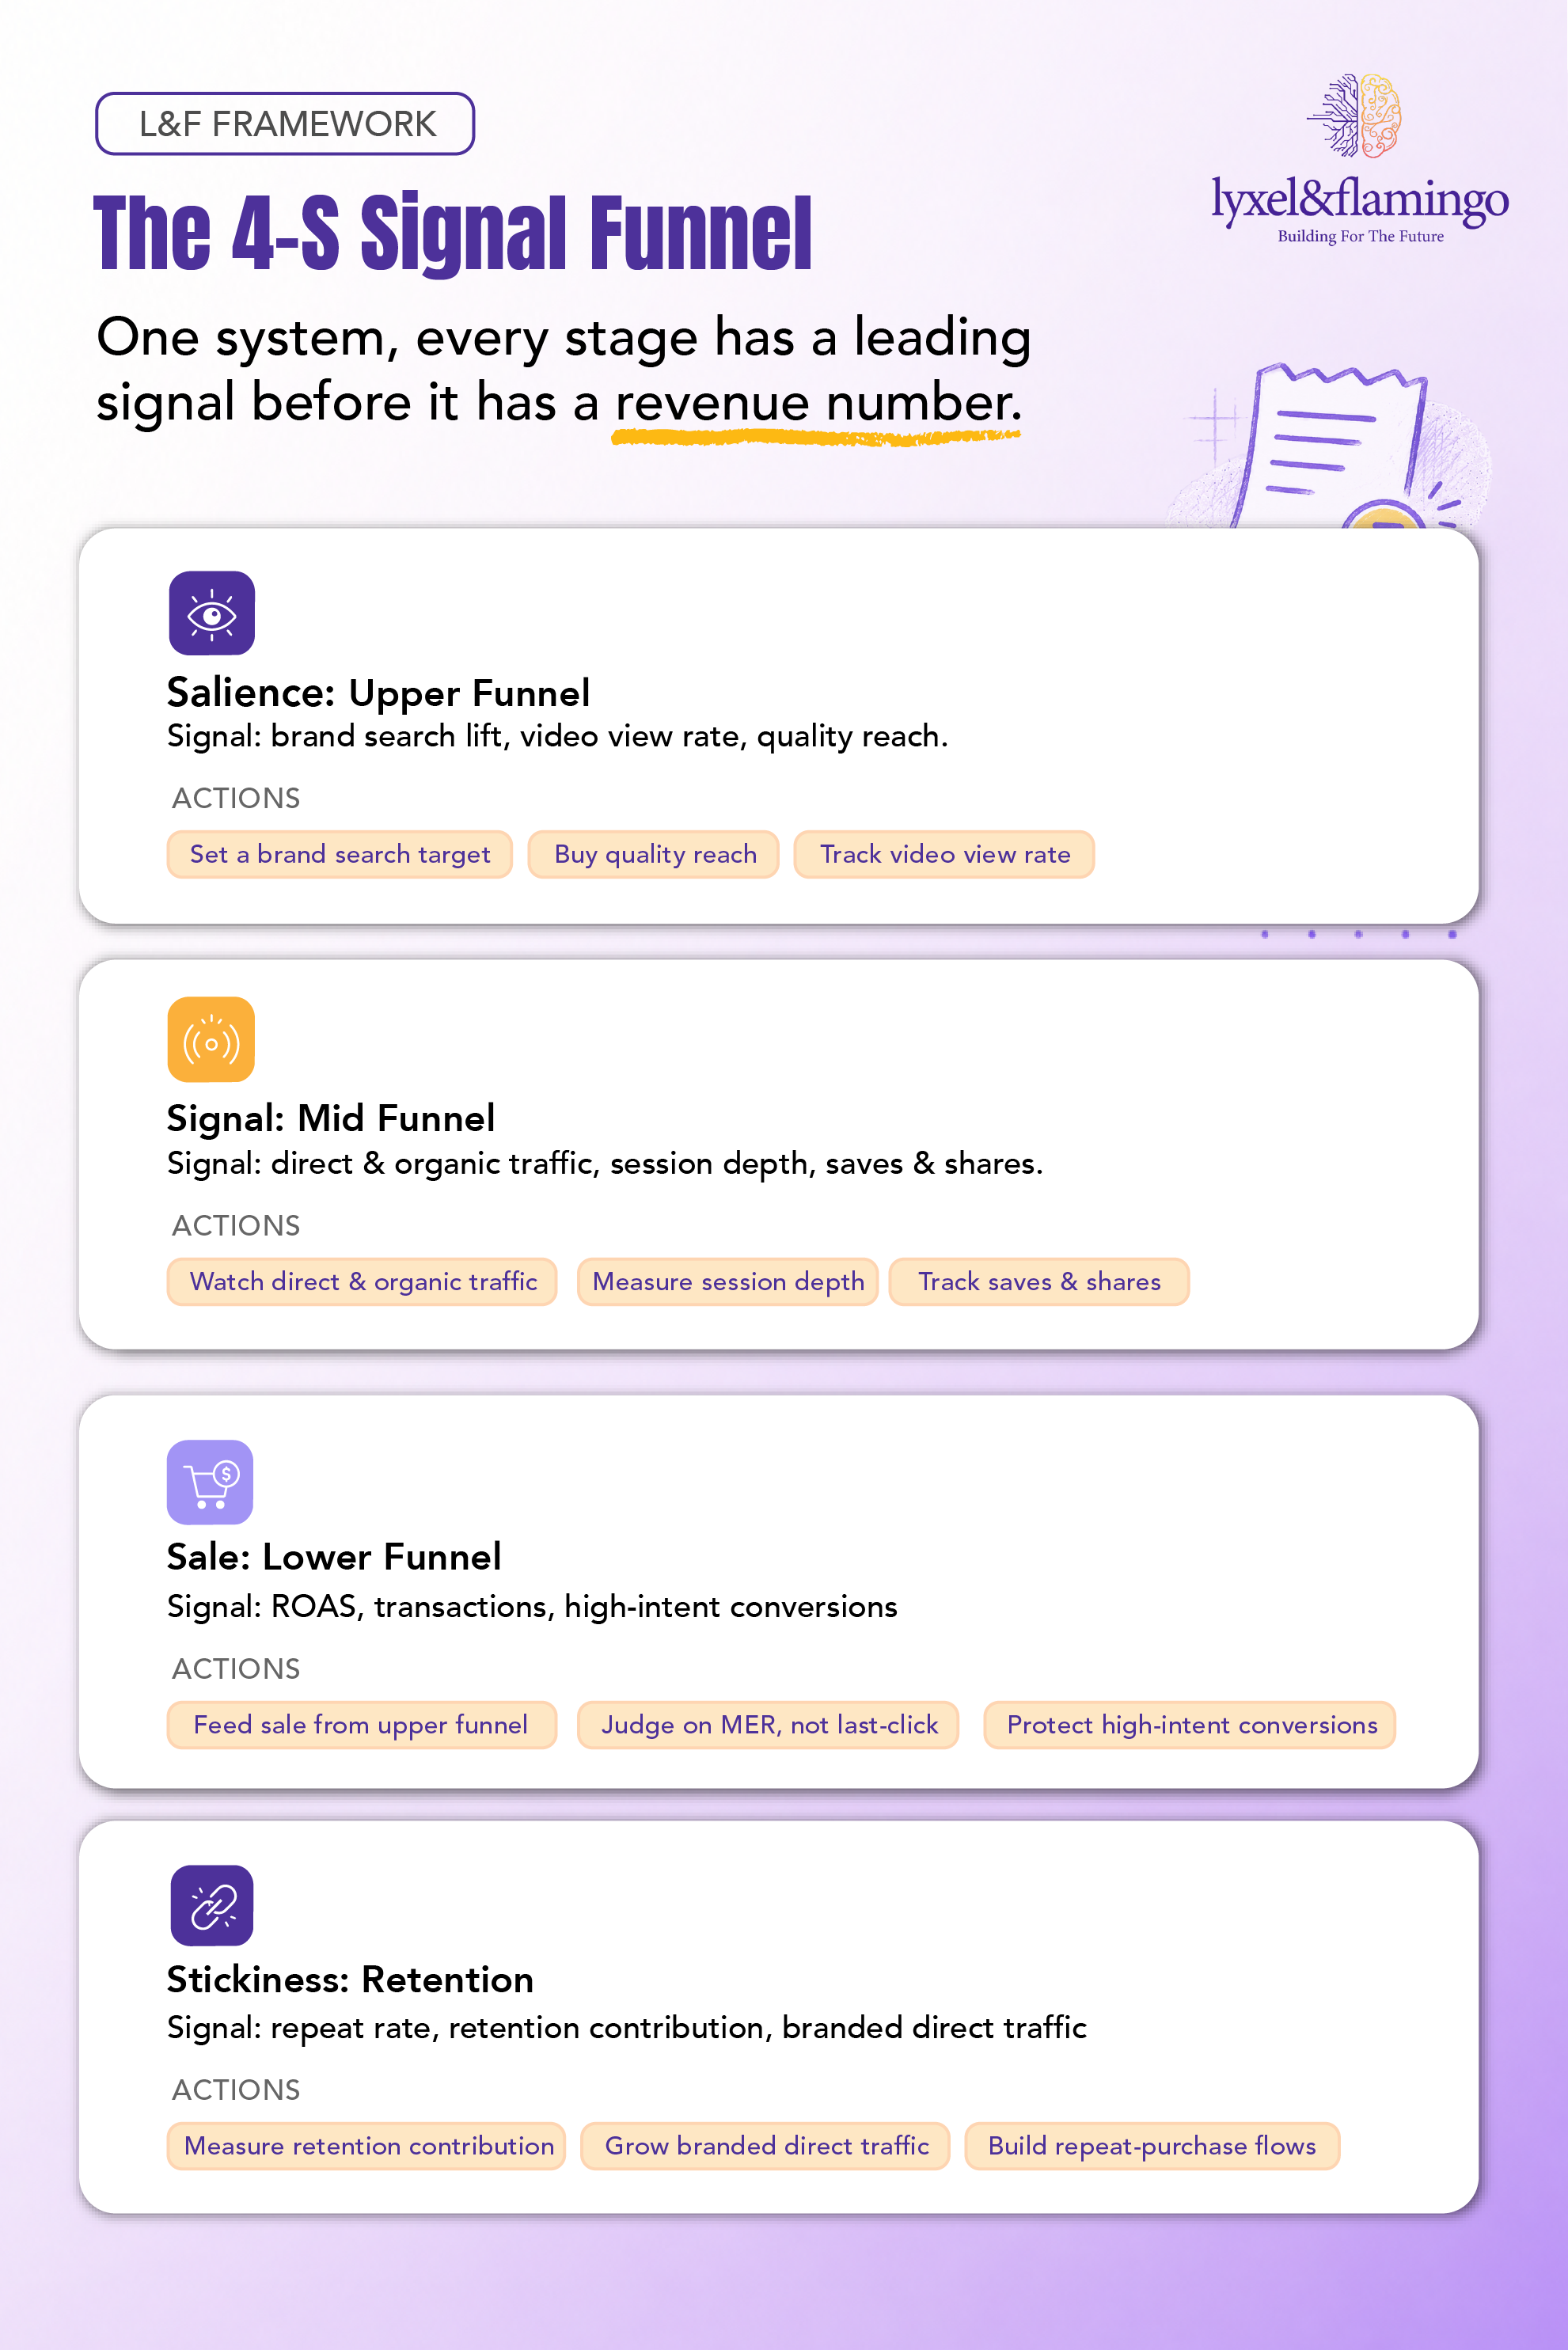
At L&F we organise all of this into a single operating model we call the 4-S Signal Funnel. It is one connected system, not four competing budgets, and every stage has a leading signal you can read before it ever produces a revenue number.
01. Salience (Upper Funnel):
Salience is the work that makes your brand easy to think of. Its job is not to sell today; it is to create the demand that everything downstream will later capture. Because it does not convert immediately, last-click under-credits it, and it is usually the first thing cut in a review, which is precisely the mistake. The leading signals for Salience are branded search lift and video view rate: when the work lands, people search for you by name and your view rates run ahead of the market norm. In practice, fund a named upper-funnel line, set a branded-search target, and read view rate as a live quality signal. For Kurlon, this stage produced a 42% uptick in branded search and a 90M+ engaged YouTube pool at a 55% view rate, weeks before any revenue moved.
02. Signal (Mid Funnel):
Signal is where created demand starts to show itself. The demand you built at the top surfaces here first: in rising direct and organic traffic, deeper sessions, and more saves and shares, long before it appears in a conversion report. The common mistake is not watching these at all, so the earliest proof of momentum is invisible. In practice, track direct and organic traffic as a health metric, read it against your upper-funnel flighting, and treat a rise a week or two after a burst as the demand you created showing up. For Kurlon, overall website traffic rose 330% as this stage did its job.
03. Sale (Lower Funnel):
Sale is the harvest, but it is only ever as strong as the two stages above it. This is where ROAS, transactions and high-intent conversions live, and where the temptation to over-optimise is greatest because it is the cheapest stage to measure. Judge it on blended MER and contribution margin, not last-click ROAS, and remember that when Salience and Signal are healthy, conversion gets cheaper on its own: the domain of profitable performance. For boAt, funnel-matched creative feeding this stage delivered a 4.5X ROAS; for Kurlon, the harvest reached 25X revenue from Google and a 920% jump in net revenue.
04. Stickiness (Retention):
Stickiness is the stage most brands forget: turning a customer into a compounding asset. Retention contribution, repeat rate and branded direct traffic are the signals here, and this is where margin actually lives: it costs far more to win a customer than to grow one you already have. The mistake is treating retention as an afterthought rather than a growth lever. In practice, measure retention contribution as part of the media return and build the lifecycle flows: including WhatsApp-led retention, that lower future acquisition cost. A lifecycle-driven approach for a brand like Lotto delivered an 8X retention contribution rate.
The AI Shift: Creative Is the New Targeting
There is a second shift that makes this urgent. With Advantage+ on Meta and Performance Max on Google, the algorithm now does the targeting. Every brand in every category is effectively renting the same AI, so audience-building, once the marketer’s craft, has been largely absorbed by the machine.
So where is the edge? In two places the AI cannot do for you: the creative you feed it, and the signals you teach it to chase. Creative has quietly become the new targeting: the algorithm reads every scroll, save and skip to decide who to find next, and it is now responsible for roughly half of an ad campaign’s sales impact (Nielsen). AI has also reshaped the economics of making creative, a productivity shift McKinsey values at up to 5-15% of marketing spend (McKinsey). We cover this in depth in why creative is the biggest media multiplier.
The Plumbing: Attribution and Event Tagging
Here is the part nobody puts on a keynote slide: attribution and event tagging are not analytics chores. They decide which campaign lives and which one dies.
Last-click attribution flatters the bottom funnel and starves the top: it will quietly talk you into defunding your own brand. Choose a model that credits demand creation, and prove causation with incrementality rather than correlation; our guide to MTA vs MMM vs incrementality shows how the methods fit together. Then get the events right: server-side, de-duplicated, and fired on the action that matters, not the page that happens to load. Garbage events in, confident wrong decisions out.
The measurement layer is also what lets you defend the brand budget. When you can show branded search and share of search moving, the balance that the 60/40 rule protects stops being a matter of faith and becomes a matter of evidence.
The India Layer: Click-to-WhatsApp and Phygital
Indian brands add their own high-intent layer: Click-to-WhatsApp. It turns a scroll into a qualified conversation, and it is only as good as the backend revenue you can attribute to it: see the CTWA playbook. Scaling a CTWA programme for Agilus Diagnostics from three campaigns to ten, we grew investment 119% year-on-year while cost per result rose just 4%: the kind of flat-at-scale efficiency that only appears when the measurement is honest. The same discipline connects digital demand to offline conversion, so festive and store-footfall campaigns can be read as one journey rather than two disconnected reports.
The Proof: What the Signals Delivered
Look at where the strongest results actually come from, and they are almost never the vanity metric.
- Kurlon (Full-Funnel Mattress): +42% branded search and +330% traffic moved first, then 25X revenue from Google and +920% net revenue followed.
- IndiGo (Aviation): 48% incremental sales at the same ROAS, a causal number, unlocked with a brand-control approach, alongside a 40% reduction in customer acquisition cost and 32% growth in flight searches.
- GoMechanic (Auto Services): 221% growth in purchase volume with a 47% drop in cost per purchase growth and efficiency moving together.
- boAt (Audio): 4.5X ROAS from funnel-matched creative, with a 42% lift in branded search for a brand-new sub-brand.
- Agilus Diagnostics (CTWA): scaled 3 to 10 campaigns with cost per result up just 4% while roughly doubling volume.
Different categories, same pattern: the leading signals moved first, and the revenue followed.
The Leadership Scorecard and Self-Check
If you want a scorecard that predicts rather than reports, it is short. Is branded search rising? Your upper funnel is working. Are direct and organic visits growing? purche demand is real, not rented. Is your cost per result stable as you scale? The engine is healthy. Do your events and attribution tell one honest story? Then, and only then, trust the dashboard.
Score your own operation. One point per yes:
- Branded search and share of search are on the leadership dashboard, not just revenue and ROAS.
- Direct and organic traffic are tracked as a demand-health metric.
- You judge the bottom funnel on blended MER and contribution margin, not last-click ROAS.
- Retention contribution is measured as part of the media return.
- At least one incrementality or geo-lift test runs each quarter.
- Events are server-side, de-duplicated, and fired on the action that matters.
- One reconciled source of truth exists, not five platform dashboards.
Key Takeaways
- A high ROAS can coincide with a flat business, because last-click rewards harvesting and hides demand creation.
- Watch leading signals: branded search, video view rate, direct/organic traffic, CPR-at-scale, retention contribution, not just lagging revenue.
- The 4-S Signal Funnel (Salience, Signal, Sale, Stickiness) gives every stage a signal you can read before revenue moves.
- With Advantage+ and PMax, creative and clean signal are the edge: the algorithm does the rest.
- Attribution and event tagging decide which campaign lives; get the plumbing right or the dashboard lies.
Closing
The brands that win the next few years will not be the ones with the highest reported ROAS. They will be the ones that learned to read the signals that move first, and had the nerve to act on them before the revenue line agreed. The number you steer by determines the business you build; choose a leading one.
Want to see the 4-S Signal Funnel run against your own numbers?
Frequently Asked Questions
It means the number can be flattering you while your business stagnates. A very high last-click ROAS usually indicates you are harvesting demand that already exists: often brand-term and retargeting traffic, rather than creating new demand. It looks efficient, but it caps growth at the size of existing demand and can quietly justify cutting the upper-funnel work that would lift the ceiling. The 'expense' is the growth you forgo by optimising to it.
No: it is just incomplete and easy to misread. ROAS is fine for judging a specific lower-funnel activity, but it should never be your single north star. Pair it with blended MER and contribution margin so you see the whole picture, and with leading signals like branded search so you can tell demand creation from demand harvesting. The problem is not ROAS; it is steering the entire business by last-click ROAS alone.
It is L&F's operating model for full-funnel media: Salience (upper), Signal (mid), Sale (bottom) and Stickiness (retention). The idea is that every stage has a leading signal: branded search and video view rate for Salience, direct and organic traffic for Signal, ROAS and high-intent conversions for Sale, retention contribution for Stickiness, so you can read the health of each stage before it produces a revenue number, and act while there is still time to change the outcome.
Branded search volume. It is cheap, always-on, hard to fake and immune to cookie loss, and it rises after upper-funnel work lands but before revenue reacts, typically a week or two after a reach burst. Track it as a weekly trend, cleanly separated from category and non-branded terms, and read it against your upper-funnel flighting. If you add one metric to your leadership dashboard this quarter, make it this one.
Through leading signals and incrementality, not last-click sales. Watch branded search, share of search, direct and organic traffic rise after your upper-funnel flights, and confirm causation with a simple geo holdout pause the media in matched regions and compare outcomes. For IndiGo, a brand-control experiment proved 48% incremental sales at the same ROAS, a number no last-click report could produce.
Incrementality is the causal question: what would have happened without this media? The cheapest way to answer it is a geo holdout - keep the media live in some matched regions, pause it in others, and compare the difference. It is defensible, quick to run, and a far better first step than an expensive, months-long modelling project. It is the referee that settles disagreements between other attribution methods.
Because your bidding and your reporting both run on the events you fire. If events are thin, client-side, duplicated, or fired on a page-load rather than a real action, the algorithm bids on bad signal and your dashboard credits the wrong campaigns - so good work gets defunded and weak work gets scaled. Server-side, de-duplicated, value-based events fired on the action that matters are what keep both the bidding and the decisions honest.
Two ways. First, Click-to-WhatsApp is one of the highest-intent channels available and pairs perfectly with the Stickiness stage - but only if you attribute its backend revenue rather than counting 'chats'. Second, the festive calendar concentrates demand, so the leading signals matter even more: reading branded search and cost-per-result in the run-up lets you scale into rising demand at the right moment instead of over-paying at the peak.