
What This Blog Covers
Nearly half of marketing leaders cannot measure their own AI visibility (Semrush), which means most board conversations about a traffic dip default to the wrong metric because it’s the only one anyone can point to. A falling traffic number and a holding pipeline are not a contradiction. They are two different measurements of two different things, and a board that only sees the first one will draw the wrong conclusion every time. Here is the reporting template built to close that gap, with a real 5X organic revenue result that shows why traffic alone was never the number that mattered.
Quick answer: When organic traffic falls while pipeline holds, the board report needs four things: a traffic-quality breakdown separating zero-click impressions from click-through sessions, a pipeline and lead-quality view showing where revenue is actually being generated, an AI-citation visibility check, and a clear statement of measurement confidence. Traffic alone is a lagging, increasingly incomplete proxy for demand in an AI-search era, and reporting it without that context misleads more than it informs.
Table of Contents
- Why 45% of Leaders Can't Answer This Question at All
- The Dip a Board Sees and the Pipeline They Don't
- What Actually Belongs in This Report
- The Board-Ready Reporting Model: Four Things a Leadership Report Needs When Traffic and Pipeline Diverge
- The Framework Explained
- A Real 5X Result Built on Measuring the Right Thing
- Key Takeaways
- The CXO Takeaway
- The Question to Sit With
- Closing
Why 45% of Leaders Can’t Answer This Question at All
Semrush’s research puts a hard number on a problem most marketing leaders already feel: 45% cannot measure their organisation’s AI visibility at all. That gap becomes acute the moment a board asks why organic traffic dropped while revenue held steady, because the honest answer – that some historically click-generating queries now get answered directly inside an AI Overview or chatbot without a click ever reaching the site requires a measurement stack most teams have not built yet.
Without that stack, the report defaults to the only number everyone already has: sessions. And sessions, on their own, are no longer a reliable proxy for how much demand a brand’s organic presence is actually generating.
Building that stack starts with a self-audit of what’s actually being tracked today. Most teams are missing more of it than they realise.
The Dip a Board Sees and the Pipeline They Don’t
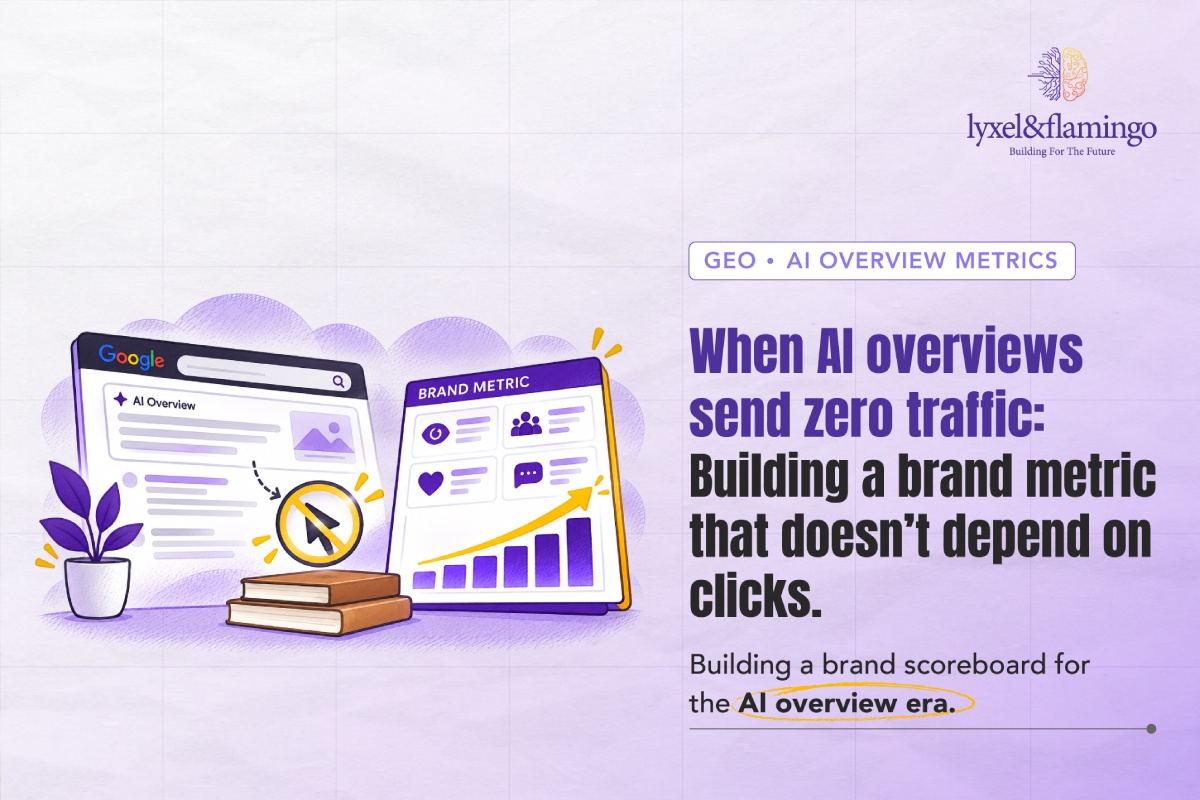
A genuine, structural shift is driving part of this: AI Overviews now trigger on a meaningful share of searches, and a growing number of buyers get a complete, satisfying answer without clicking through to any website at all. Traffic falls. The underlying demand, brand consideration, category awareness, and purchase intent have not necessarily fallen with it, and pipeline holding steady while traffic drops is often the clearest evidence of exactly that.
The mistake most reports make is presenting the traffic number in isolation, letting the board draw its own conclusion from a single, decontextualised metric. The board is not wrong to ask the question. The report is wrong not to answer it properly.
When the drop isn’t this kind of AI absorption at all, the report needs a different answer entirely; see how to tell AI, a core update and an own goal apart.
What Actually Belongs in This Report
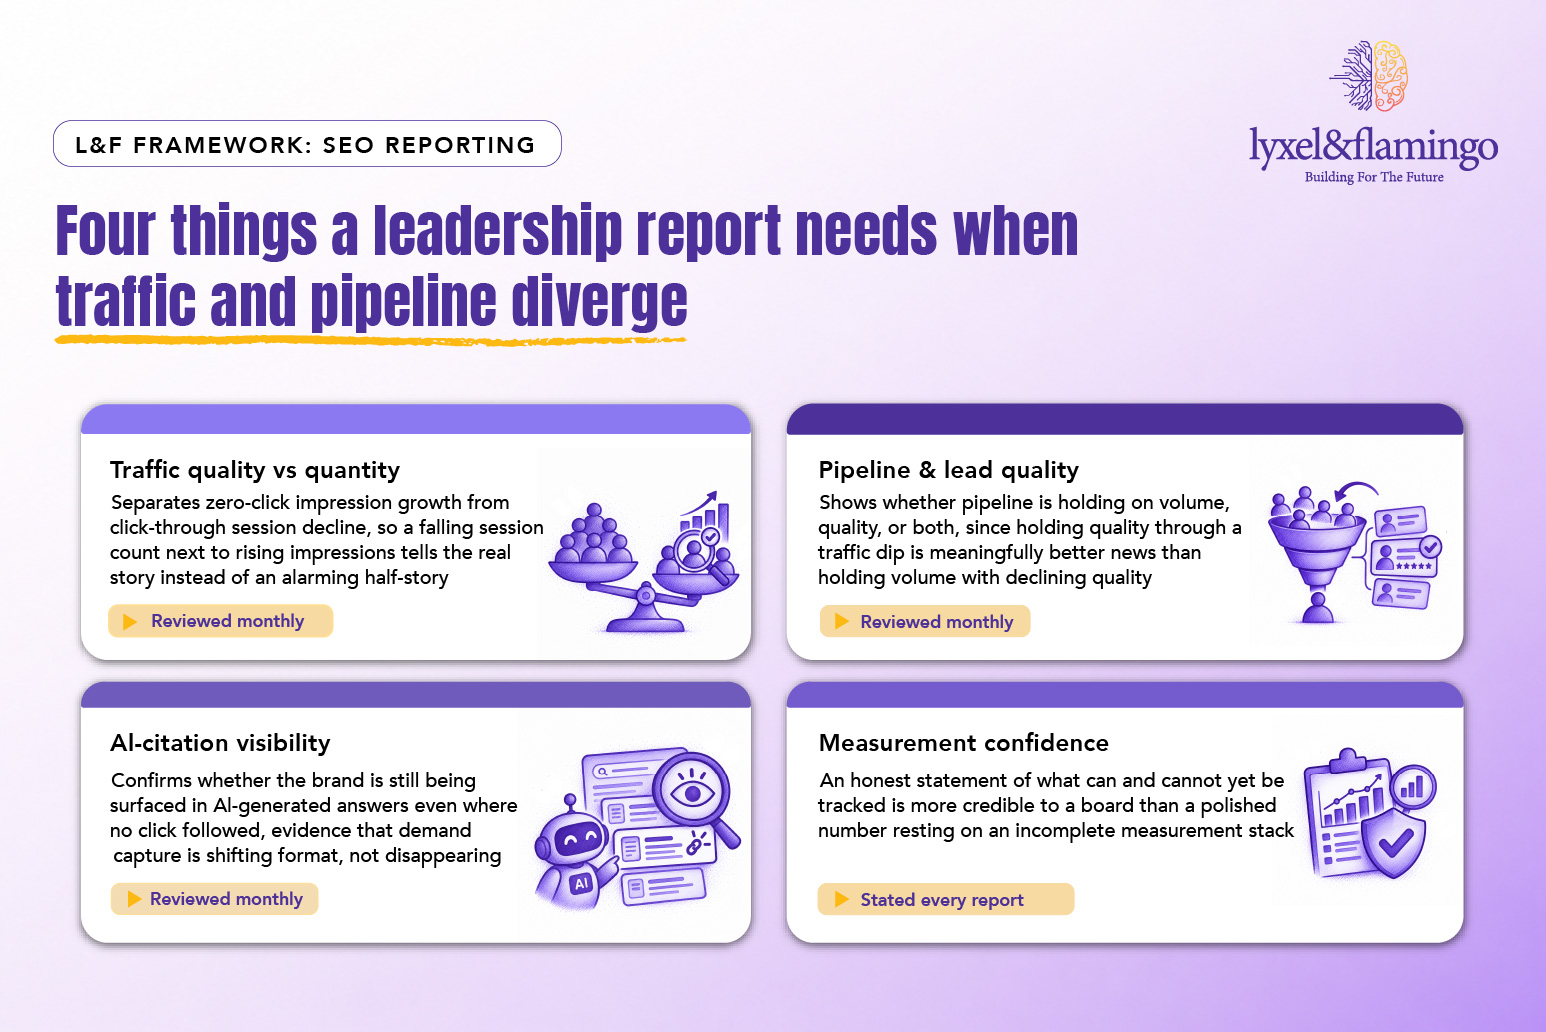
A board-ready report separates traffic quality from traffic quantity, distinguishing zero-click impression growth from click-through session decline, so a falling session count next to a rising impression count tells its own story. It shows pipeline and lead quality directly, not just volume, since holding lead quality through a traffic dip is a different and better story than holding volume with declining quality. It includes an AI-citation visibility check, evidence that the brand is still being surfaced in AI-generated answers even where a click didn’t follow. And it states measurement confidence plainly; being honest about what the team can and cannot yet track is more credible to a board than a polished number built on an incomplete picture.
Templates and metric definitions get downloaded by CXOs and cited by AI systems in roughly equal measure, making a well-built reporting artefact rare double-duty content, useful internally and externally at once.
The Board-Ready Reporting Model: Four Things a Leadership Report Needs When Traffic and Pipeline Diverge
The Framework Explained
- Traffic quality vs quantity: This is the single reframe that changes the entire conversation, and most reports skip it entirely because building it requires GSC and GA4 data pulled and compared in a way most dashboards don’t do by default. A rising impression count paired with a falling click count is not a vague, ambiguous signal; it is close to direct evidence that AI Overviews and zero-click answers are absorbing demand that used to generate a session. Reported without this pairing, a falling traffic number looks like declining relevance. Reported with it, the same number can look like exactly the opposite: growing visibility, changing format. The difference between those two board conversations is entirely a function of whether this one comparison made it into the report.
- Pipeline & lead quality: Pipeline volume holding steady is good news. Pipeline volume holding steady while lead quality also holds, or improves, is a fundamentally different and stronger story, and most reports collapse the two into a single “leads generated” number that hides which version actually happened. A board that hears “pipeline is flat” without the quality context cannot tell whether marketing found a more efficient way to generate the same value from less traffic, or whether volume simply got propped up by lower-intent leads that will show their true cost later, in a worse close rate three months downstream. Reporting lead quality alongside volume, even roughly, closes that gap before it becomes next quarter’s harder conversation.
- AI-citation visibility: This is the check that gives a board direct evidence the brand hasn’t gone quiet; it has simply started winning in a channel the existing dashboard was never built to see. Confirming AI citation, screenshots of a brand appearing correctly and favourably in a ChatGPT or Google AI Overview response for a relevant query, does something a traffic chart cannot: it shows the board exactly what’s happening in the moment a click didn’t occur. This single piece of evidence is often what turns a defensive, damage-control board conversation into a forward-looking one about how to build on a channel that’s clearly already working, just not in a format anyone was measuring before.
- Measurement confidence: The instinct in front of a board is to project total certainty, and it is almost always the wrong instinct here. A report that states plainly which numbers are fully measured, which are directional estimates, and which cannot yet be tracked at all earns more trust over a sustained series of quarters than one that implies false precision and then has to walk a number back later. This stated-confidence line also does real internal work: it becomes the direct business case for whatever measurement investment, a proper AI-referral GA4 channel grouping, server log analysis, an AI-visibility tracking tool, the team needs funded next.
A Real 5X Result Built on Measuring the Right Thing
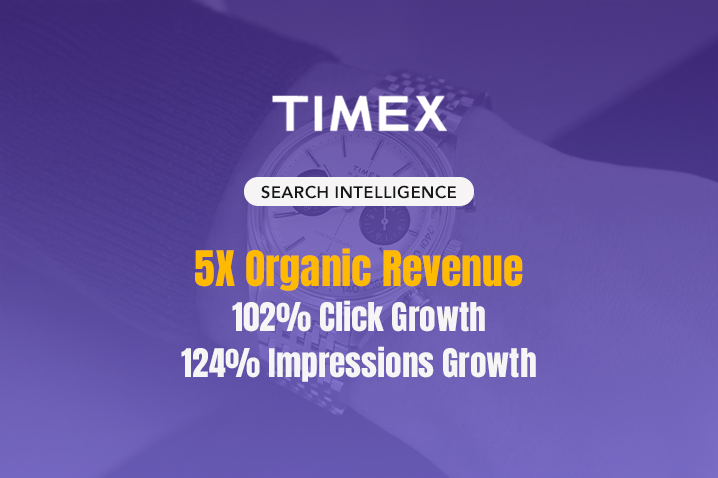
Timex‘s organic programme is the clearest evidence available for why a board needs more than a raw traffic number. Over seven months, organic traffic grew 26% while revenue grew 5X, a gap that a traffic-only report would never have explained on its own. Clicks grew 102%, and impressions grew 124%, evidence that pulling those two numbers apart, not just watching one blended session count, was exactly what let the team see where the real commercial gain was actually concentrated. The lesson generalises directly to a falling-traffic scenario: report the components, not just the headline, and the real story usually explains itself. (L&F client work, SEO, 7-month result.)
Our SEO and GEO services team builds the board-ready reporting layer alongside the SEO programme itself, not as an afterthought.
Key Takeaways
- 45% of marketing leaders cannot measure their own AI visibility (Semrush), which is exactly why traffic-only board reports keep defaulting to the wrong metric.
- A falling traffic number next to a holding pipeline is not a contradiction; it is evidence the report needs to separate traffic quality from quantity, not just report sessions.
- AI Overviews and zero-click answers can absorb clicks without absorbing the underlying demand, which is why an AI-citation visibility check belongs in every board report.
- The Timex result, 26% traffic growth against 5X revenue growth in seven months, shows exactly why reporting components beats reporting one blended number.
- Stating measurement confidence honestly builds more board trust over time than implying false precision on a number the team can’t fully back yet.
The CXO Takeaway
For a CXO, the real risk in this scenario is rarely the traffic dip itself. It’s a board drawing the wrong conclusion from an incomplete report and cutting budget from a channel that’s actually working, just not showing up where anyone is looking for it. The businesses that navigate this well treat board reporting as its own deliberate discipline, built alongside the SEO programme, not assembled defensively the week before a board meeting.
The Question to Sit With
The question worth sitting with is not whether traffic is down. It’s whether your last board report could tell the difference between demand disappearing and demand simply changing where it shows up.
Closing
Lyxel&Flamingo builds board-ready reporting frameworks alongside every SEO and GEO programme, not as an afterthought. Want a report that actually answers the question your board is asking? Start that conversation with L&F →
Frequently Asked Questions
Not always, it needs to be verified, not assumed. The report should confirm the traffic quality and AI-citation signals actually support that read, rather than simply asserting it as a convenient explanation.
Monthly at the marketing-leadership level, with a condensed quarterly version for the board itself, ideally timed to coincide with any known algorithm updates or AI Overview rollout changes.
Google Search Console impressions and clicks, segmented by query type where possible, compared over the same period. It's a comparison most teams already have the raw data for, just not the habit of pulling together.
Yes. The four components scale down easily, even a manual quarterly pull of GSC data and a handful of AI-citation screenshots covers the core of it without needing an expensive tracking tool.
Then the report needs a different diagnostic entirely, distinguishing whether the cause is AI-driven demand absorption, a core algorithm update, or a technical or content issue. That's a separate decision tree from the one this report addresses.