
What this blog covers
This blog reframes the media budget as a profit-and-loss statement rather than a single spend figure. It explains why revenue-level metrics like ROAS flatter media and hide losses, walks through building a media P&L line by line, shows where contribution margin sits and why it should be the number leadership steers by, and translates the idea into how to plan, scale, and report. It closes with a self-check and the questions finance leaders ask most.
Table of Contents
The number on the media line
In most planning meetings, media appears as one figure: the budget. It sits on a cost line, gets defended or trimmed, and the conversation moves on. The result is that media is managed like an expense to be controlled rather than an investment to be understood. When the only question is how big the number is, nobody is asking the more useful question: what that number produces after every cost of producing it.
The brands that scale profitably treat their media the way finance treats the rest of the business: as a P&L. They trace the money from the revenue it generates, down through the cost of the goods sold, the returns, the fulfilment and the media itself, to the profit that remains. That remaining number is contribution margin, and once a team starts steering by it, a lot of confident decisions built on ROAS start to look shaky.
Why revenue metrics flatter media
Return on ad spend is the metric most teams live on, and it has a quiet flaw: it stops at revenue. ROAS divides the revenue a campaign is credited with by the amount spent on ads, and says nothing about what it cost to make and deliver the product behind that revenue. A brand can post a healthy ROAS on a product that loses money on every unit once its cost of goods, discounts, shipping, and returns are counted. The dashboard looks strong while the bank balance quietly shrinks; the shift toward metrics beyond ROAS exists precisely to close that gap.
The problem compounds when margins vary across the range. Push spend behind the products with the best ROAS and a team can inadvertently push behind the products with the worst margins, scaling revenue and shrinking profit at the same time. A revenue-level metric cannot see any of this. A P&L can, because it carries every cost through to the line that the business actually banks.
The media P&L, line by line
A media P&L is a short, honest statement that runs from the revenue media drives down to the profit it leaves. It reads from the top down.
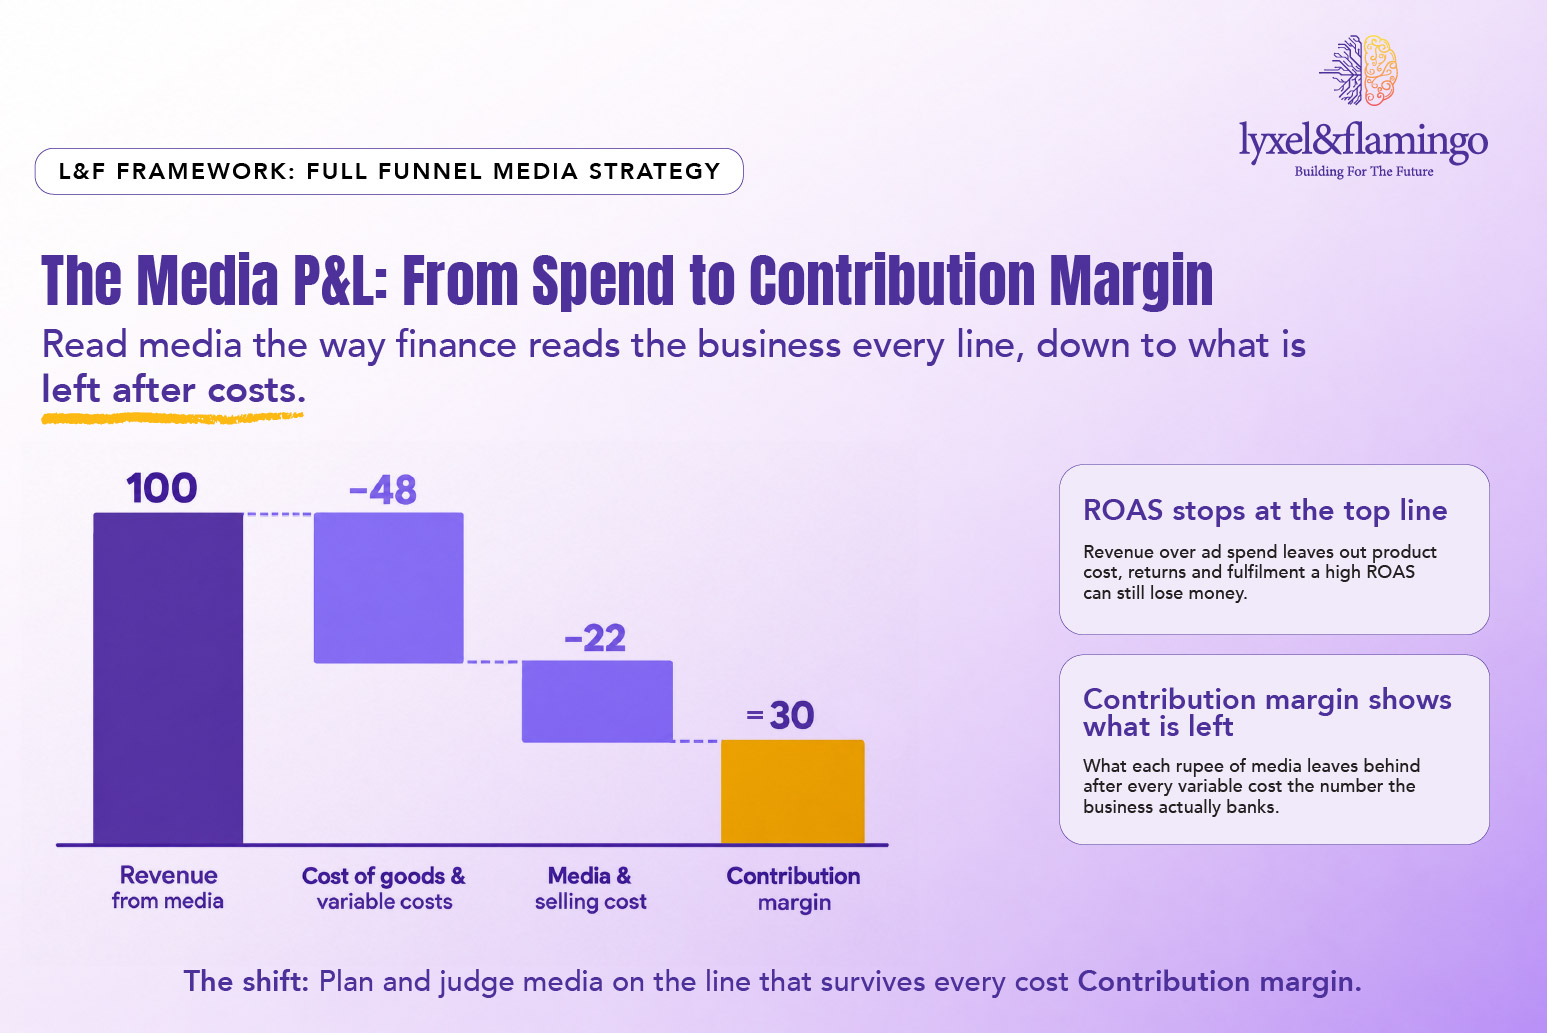
Framework: The Media P&L from revenue to contribution margin.
At the top sits revenue from media the sales the media is genuinely responsible for, ideally measured with incrementality rather than last-click claims. From that, the P&L subtracts the cost of goods sold and the other variable costs that scale with each sale: discounts and promotions, payment fees, shipping and fulfilment, and the cost of returns, which in categories like fashion can be substantial. Then it subtracts the media and selling cost itself – the working spend plus the fees to run it. What remains, once every cost that varies with the sale has been taken out, is contribution margin: the profit each rupee of media contributes toward the fixed costs and, ultimately, the bottom line. Building it once, cleanly, changes the conversation from how much a brand is spending to what that spending leaves behind.
Related blog: Incrementality at Scale: Geo Experiments for Enterprise Marketing, which walks through how to run and read a geo-lift test properly.
Where contribution margin sits and why it should lead
Contribution margin is the line at the bottom of the media P&L, and it deserves to be the number leadership steers by because it is the only one that reflects the full cost of growth. Revenue tells you how loud the engine is; contribution margin tells you whether it is actually pulling the business forward. A campaign with a lower ROAS but a healthier margin can be worth far more than a high-ROAS campaign selling a thin-margin product at a discount.
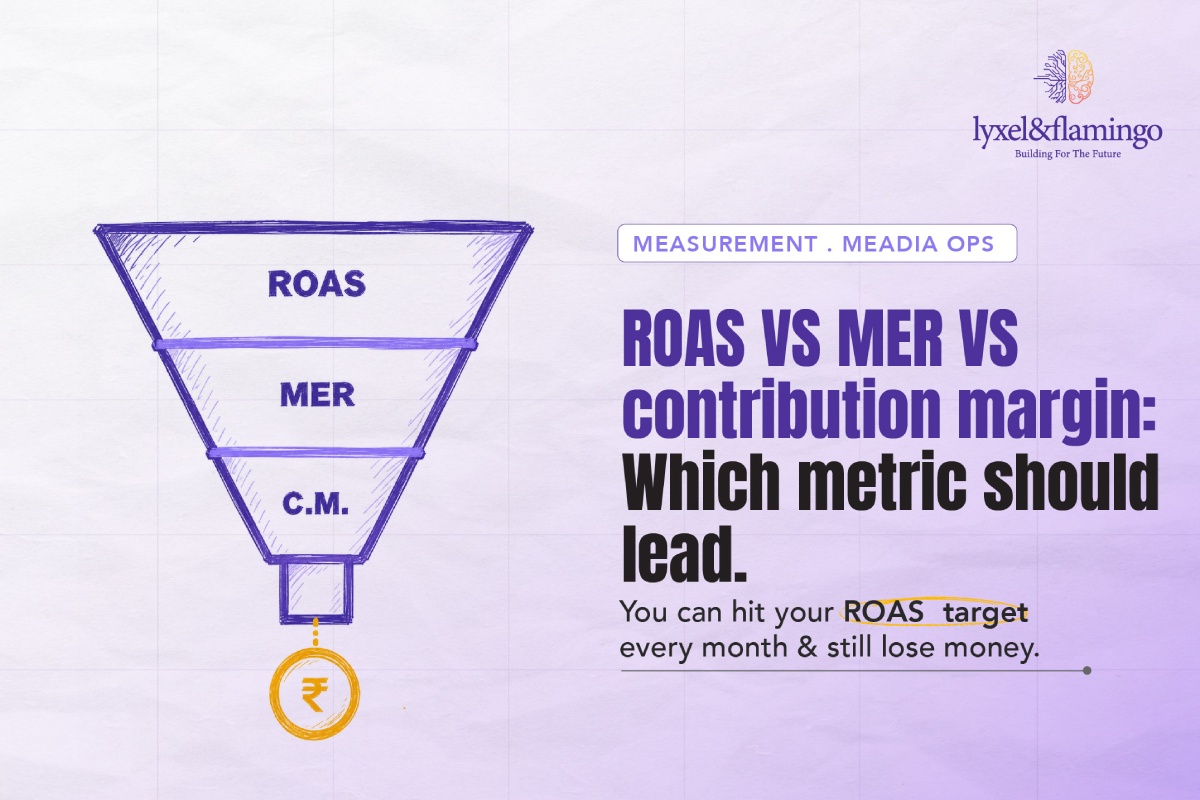
This does not retire ROAS or blended efficiency measures; they remain useful for optimising day-to-day. It puts them in their place, as inputs to the profit view rather than the destination. The relationship between ROAS, blended MER and contribution margin is worth understanding in full, since each answers a different question about the same spend, a topic we cover in ROAS vs MER vs contribution margin.
How a media P&L changes the scaling decision
The clearest value of a media P&L shows up at the moment a brand decides whether to scale. Judged on ROAS, scaling looks simple: find the campaigns with the best return and pour in budget. Judged on contribution margin, the same decision becomes sharper and safer, because a team can see the point at which the next rupee of spend stops leaving profit behind.
This is the discipline behind scaling that holds up under pressure. Shawarmer is a useful example: by tightening measurement and cutting what the honest numbers showed was waste, the team improved ROAS by 23% on 34% lower spend a decision that only makes sense when the goal is profit rather than revenue. GoMechanic tells the same story from the growth side, with a 221% rise in purchase volume alongside a 47% drop in cost per purchase, growth and efficiency moving together because the funnel and the measurement were built to protect margin. In both, the media was managed as a P&L, and the P&L pointed to a better decision than the revenue line would have.
Related blog: When to Prioritise Brand vs Performance Marketing, on the channel-level version of the same scaling choice.
How to plan and report against it
Putting a media P&L into practice takes three shifts in how a team plans and reports. The first is to build the statement once and keep it live: agree the cost lines with finance, so marketing and finance are reading the same definition of a good result rather than grading the same campaign on different numbers. The second is to bring the true costs into the media view product cost, returns and fulfilment by product or category so the margin reality of what is being scaled is visible at the point of decision. The third is to lead the reporting with contribution margin, keeping ROAS and blended MER as supporting lines that explain the movement rather than headline it. Reported this way, media stops being a cost to be defended and becomes an investment whose return the whole leadership team can read.
Related blog: From Campaigns to Systems: Why Enterprise Marketing Needs a New Operating Model, where a shared taxonomy is what lets marketing and finance read the same result the same way.
Self-check: how financially literate is your media?
Score your own operation one point per yes:
- Media is planned and judged on contribution margin, not ROAS alone
- Product cost, returns and fulfilment are visible in the media view
- Finance and marketing share one definition of a profitable campaign
- Revenue attributed to media is measured with incrementality, not last-click alone
- Scaling decisions are made on the margin the next rupee leaves, not the ROAS it posts
- You can see margin by product or category, not just a blended average
- Leadership reporting leads with margin and keeps ROAS as a supporting line
Five or more and your media reads like a P&L. Three or fewer, and you are probably steering profit by a revenue number.
Key takeaways
- A media budget managed as a single cost line hides whether the spend actually produces profit.
- ROAS stops at revenue, so a high ROAS can sit on top of a product that loses money once all costs are counted.
- A media P&L runs from media-driven revenue down through every variable cost to contribution margin.
- Contribution margin should lead the leadership view; ROAS and MER become inputs that explain it.
- The margin view sharpens the scaling decision – showing the point where the next rupee stops leaving profit.
Closing
Every business already runs a P&L; the oversight is leaving media out of it. When the media line is read like the rest of the business revenue in, every cost carried through, profit at the bottom, the questions change, and the decisions get better. A brand stops asking how much it can spend and starts asking what that spend will leave behind. That single change in the number on the page is often the difference between growth that flatters the dashboard and growth the business can actually bank.
Want your media managed as a P&L, not a cost line?
L&F builds the media P&L: true costs, honest attribution, and contribution margin as the number you steer by for consumer brands across India and worldwide. We will map your media to the line the business actually banks. Talk to L&F about media measurement and read your media the way finance reads the business.
Frequently Asked Questions
A media P&L is a profit-and-loss view of your marketing investment. It starts from the revenue your media drives, then subtracts every variable cost tied to those sales cost of goods, discounts, payment fees, shipping, returns and the media and selling cost itself, to arrive at contribution margin. It reframes the media budget from a single cost figure into a statement that shows what the spend leaves behind after all the costs of producing that revenue.
Contribution margin is the profit each rupee of media leaves once every variable cost of the sale has been subtracted - product cost, returns, fulfilment, fees and the media spend. It is the amount that then contributes toward fixed costs and profit. In a marketing context it matters because it reflects the true economics of growth: a campaign can look efficient on revenue and still fail on contribution margin if the product it sells carries a thin margin.
Because ROAS stops at revenue. It divides credited revenue by ad spend and ignores what it cost to make and deliver the product behind that revenue. A brand can post a strong ROAS on a product that loses money per unit once cost of goods, discounts, shipping and returns are counted. ROAS is useful for day-to-day optimisation, but steering the business by it alone can scale revenue while shrinking profit.
Start from the revenue your media genuinely drives, measured with incrementality where possible rather than last-click. Subtract the variable costs that scale with each sale: cost of goods, discounts and promotions, payment fees, shipping and fulfilment, and returns. Then subtract the working media spend and the fees to run it. What remains is contribution margin. Agree every cost line with finance so both teams read the same statement, and keep it live rather than building it once.
MER (marketing efficiency ratio) is total revenue divided by total marketing spend a blended, engine-level efficiency measure that still sits at the revenue level. Contribution margin goes a step further and subtracts the cost of goods and other variable costs to show the profit left behind. MER is excellent for steering overall efficiency; contribution margin is what you use to decide whether growth is actually profitable and what to scale.
It moves the scaling decision from revenue to profit. On ROAS, you scale the campaigns with the best return. On a media P&L, you scale while each additional rupee of spend still leaves contribution margin behind, and you stop when it no longer does. That protects you from the common trap of pouring budget behind high-ROAS but thin-margin products, which grows revenue while quietly eroding profit.
Both, on one shared definition. The most common failure is marketing and finance grading the same spend on different numbers marketing on ROAS, finance on margin. A media P&L works when the cost lines are agreed jointly and both functions read the same statement, so a good result means the same thing to everyone. Marketing typically owns the media inputs; finance owns the cost inputs; the P&L is the shared language between them.