
What this blog covers
Marketing teams rarely struggle with reporting. They struggle with proving business impact. This blog explains why campaign metrics such as CTR, ROAS, impressions, and CPL fail to answer the questions boards and finance teams care about. It breaks down the gap between attribution reports and financial reporting, then explains why those numbers rarely match. The article also explores how privacy changes and incomplete tracking have made traditional attribution less reliable, pushing more brands toward marketing mix modelling and incrementality testing.
Table of Contents
- What Are Marketing ROI Proof Points?
- The Board Doesn't Care About Your CTR
- Why Attribution Data and Finance Data Never Agree on the Same Number
- The Evidence Behind the Disconnect
- The Revenue Proof Chain: Lyxel&Flamingo's Framework for Linking Campaigns to Revenue
- Four Things to Fix Before Your Next Budget Review
- Conclusion
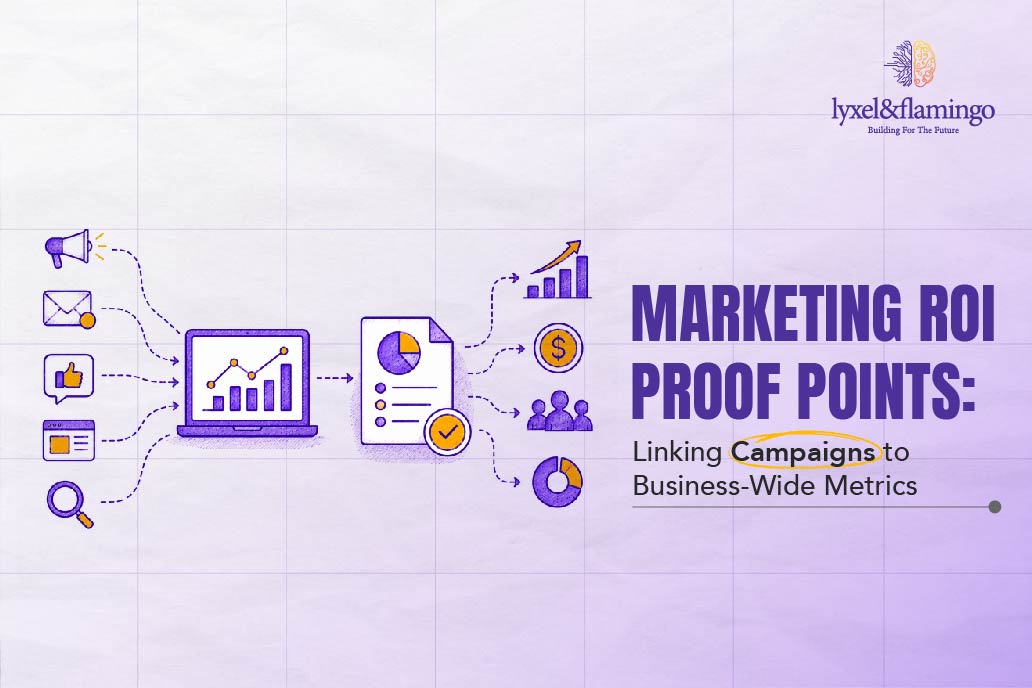
Along the way, it introduces Lyxel&Flamingo’s Revenue Proof Chain, a practical framework that connects campaign data with CRM records, revenue, margins, and finance-approved outcomes. The blog ends with four changes every marketing team should make before the next budget review, from building CRM links to agreeing on ROI definitions with finance. Better dashboards are not enough anymore. Brands need evidence that connects every marketing decision with measurable business growth and long-term profitability.
Marketing budgets have sat at roughly 7.7% of company revenue for two years straight, and boards still are not buying the ROI story marketing tells them. That’s not a spending problem. It’s a proof problem. Most marketing teams have never built real marketing ROI proof points, the specific links between campaign activity and the metrics finance already tracks, and the gap shows the moment anyone opens a boardroom deck.
Every campaign begins as a decision inside Media Creative Optimisation, the platform and creative calls that decide where a rupee goes. It ends up reported back as clicks, CPMs, and ROAS. None of that survives contact with a CFO. Most marketing teams can report a channel’s performance to two decimal places and still cannot answer the one question a board asks:
What did this do to revenue?
Those are two different reporting systems, built for two different rooms, and most CMOs are still presenting the wrong one to the wrong audience.
The gap between campaign-level KPIs and business-wide financial metrics is now the single biggest credibility risk facing marketing leadership, ahead of creative quality, channel mix, or even budget size.
What Are Marketing ROI Proof Points?
Marketing ROI proof points are specific, evidence-backed links between a campaign or channel and a business outcome finance already tracks: revenue, contribution margin, retention, or customer lifetime value. They are not the same thing as a campaign report. A campaign report says a channel performed well by its own metrics. A proof point shows that performance moved a number the board already cares about and highlights the work behind it.
That distinction matters more now than it did three years ago. Budgets are flat, board scrutiny is climbing fast, and marketing ROI measurement built only on platform-reported numbers can’t survive a finance review anymore. A brand that cannot connect campaign activity to revenue isn’t really measuring ROI. It’s measuring activity, and hoping it counts. At its core, this is just about linking marketing to business metrics that finance already trusts, rather than defending a set of numbers that marketing invented for itself.
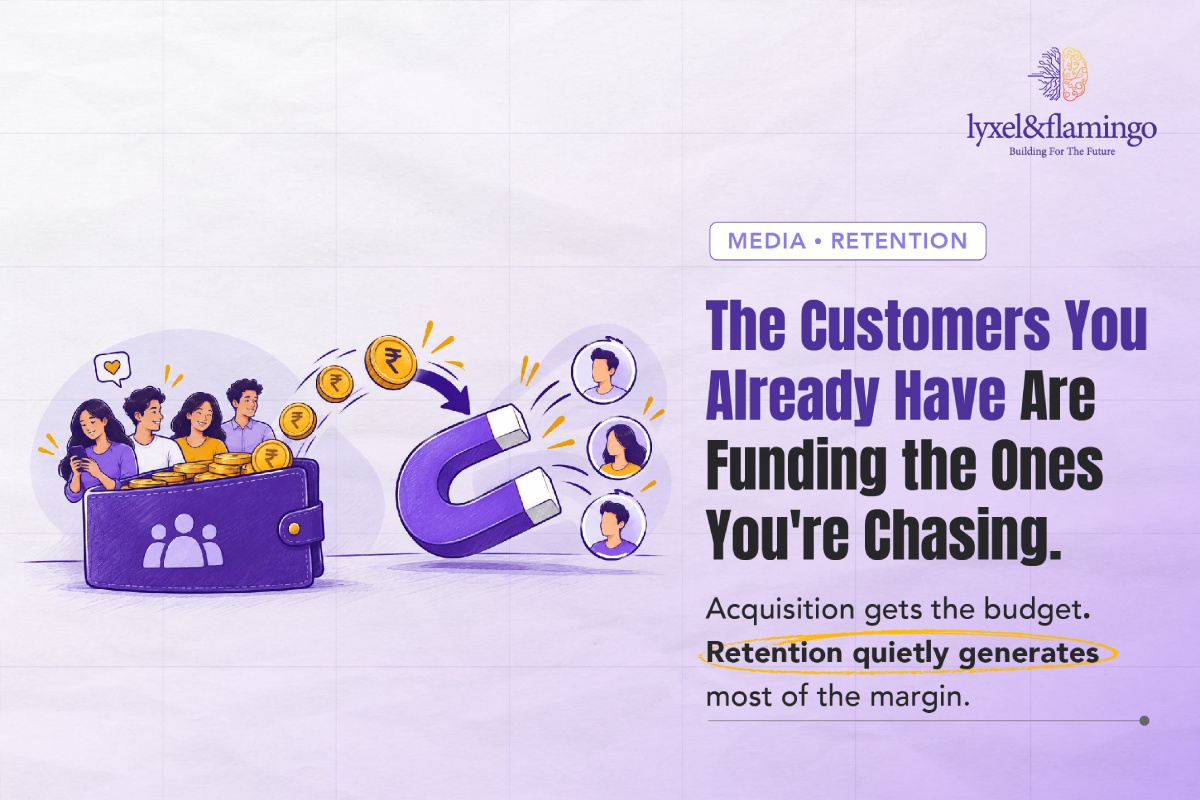
Want to see what proving business impact looks like when the metric is retention instead of revenue? Read this blog: Cohort-Based Marketing: The Customer Retention Strategy Enterprises Are Still Getting Wrong
The Board Doesn’t Care About Your CTR
For most marketing leaders today, it’s closer to routine than exception. Board-level pressure on marketing to prove its worth rose sharply between 2023 and 2025, and half of marketing leaders now report direct pressure from the board itself, up from a third two years earlier. 63% report rising pressure from their own CFO specifically, and demonstrating marketing’s impact on financial results has become the single biggest challenge CMOs name, ahead of talent gaps or CMO marketing accountability metrics debates over budget size.
It isn’t just a pressure problem, either. Most marketing leaders are genuinely unsure which numbers to defend in the first place. More than a third say they’re uncertain which metrics matter most to their business, and only 30% believe they have adequate analytics resources to support real decision-making.
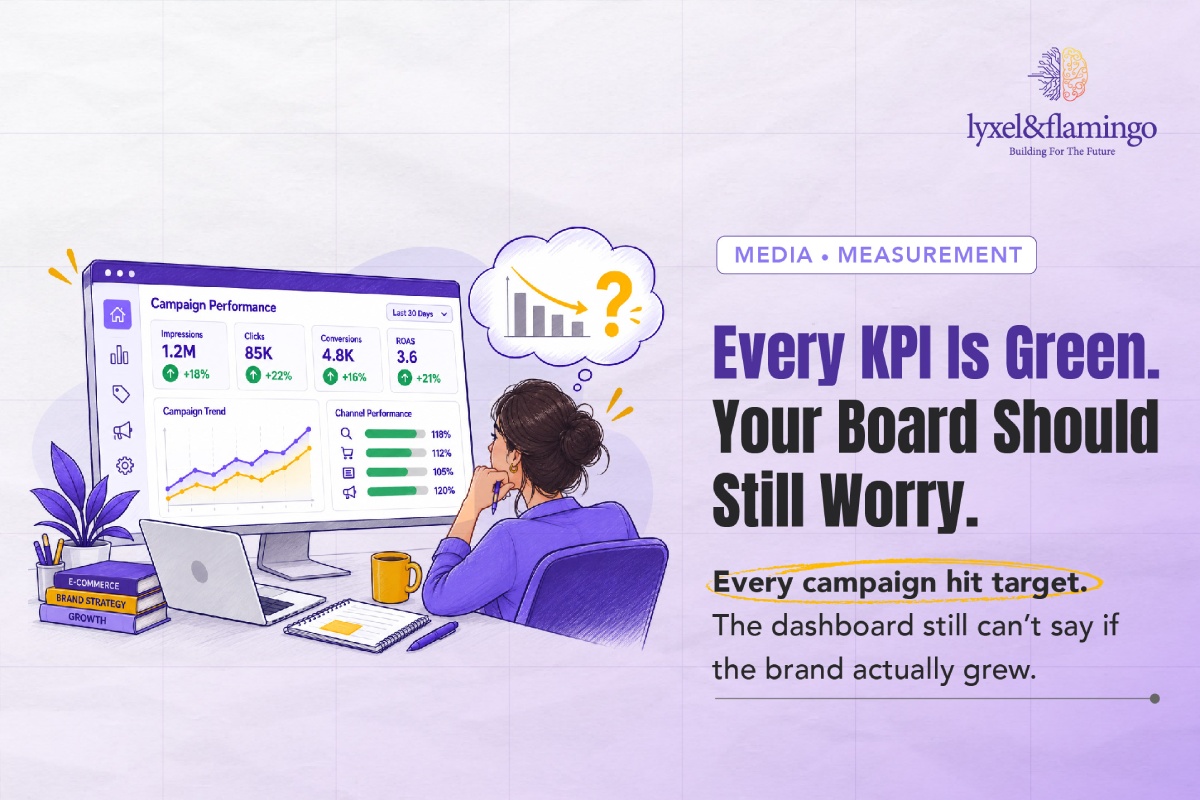
Most teams respond by building a better marketing KPI dashboard. That’s the wrong fix. A prettier chart of the same platform metrics doesn’t answer a finance question, because platform metrics were never designed to answer it. Google and Meta report what happened inside their own walled gardens. They weren’t built to reconcile with a P&L.
Marketing teams keep upgrading their reporting tools while the actual problem, a missing translation layer between campaign data and business metrics, stays exactly where it was.
Want to see this same board-versus-marketing standoff play out over a completely different line item? Read this blog: Your Website Is a Growth Engine, Not a Line Item: A CXO’s Guide to Web ROI
Why Attribution Data and Finance Data Never Agree on the Same Number
Platform attribution, Google’s Data-Driven Attribution model inside GA4, Meta’s Conversions API, Amazon’s own attribution reporting, assigns credit for a conversion using probabilistic or rules-based models built and maintained by the platform that benefits from taking the credit. Every platform is, in effect, grading its own homework. Most teams also default to whichever marketing attribution model their ad platform ships with, first-click, last-click, linear, or a black-box algorithmic blend, without ever checking whether that model fits their actual sales cycle. Search Engine Journal’s breakdown of attribution models is a fair starting point if your team has never compared them side by side.
Finance, meanwhile, works off actuals: booked revenue, cost of goods, returns, and margin, recognised on an accounting calendar that has nothing to do with a campaign flight date. One system is optimistic by design. The other is conservative and slow by design. They were never going to reconcile on their own.
Privacy changes made this worse, not better. iOS App Tracking Transparency and the steady erosion of third-party cookies have cut usable identity coverage roughly in half compared with the cookie-era baseline. That means marketing attribution model outputs are now working from a smaller, more biased slice of the customer journey than they were five years ago. A model built on incomplete data doesn’t get more honest as a result. It just gets more confident about less information.
This is the real reason marketing mix modelling is back in serious budget conversations. MMM never depended on user-level tracking in the first place. It regresses aggregate spend against aggregate business outcomes at a market level, which sidesteps the identity problem entirely. Google open-sourced its own MMM tool, Meridian, in February 2025, and Forrester’s coverage at launch called it a step change for budget allocation that doesn’t depend on tracking a single user. Think of it as revenue attribution marketing at the market level instead of the click level: less precise about any one touchpoint, far harder to game.
The brands solving this aren’t trying to perfect attribution. They’re building a second, independent system that checks the first one’s work.
The Evidence Behind the Disconnect
Here’s what the data says heading into 2026 budget cycles, and it’s a mixed picture for performance marketing ROI 2026 planning.
- Marketing budgets have been flat at roughly 7.7 to 7.8% of company revenue for two years running, even as scrutiny of that spend intensifies. 59% of CMOs say they lack enough budget to execute their strategy at all.
- Brands that connect brand-building and performance media into one measurement system see 25 to 100% higher revenue returns from identical spend, a 90% median uplift. Overinvesting in performance-only tracking cuts total revenue returns by 20 to 50% instead.
- Budget size explains 89% of the variation in campaign payback. ROI explains just 11%, yet 65% of marketers still rank ROI as the top driver of effectiveness. That belief gap has a cost: net profit generated across the IPA Effectiveness Databank is down 11% since the pandemic, even as reported ROI ticked up 4% over the same period.
- Leading marketers achieve median revenue growth six times higher than competitors while spending only 1.5 times more, implying roughly four times higher marketing ROI. The gap is not about budget size. It’s about measurement and execution discipline.
- 72% of CMOs plan to grow their 2026 budgets relative to sales, but most still cannot demonstrate ROI on more than half of what they already spend. Growth intentions are outrunning proof capability, not the other way round.
- Closer to home, India adds its own version of this pressure. The country’s digital advertising market is set to nearly double to US$22 billion by 2030, which means the absolute rupee value riding on unproven campaigns is about to grow a lot faster than most measurement teams are.
The Revenue Proof Chain: Lyxel&Flamingo’s Framework for Linking Campaigns to Revenue
At Lyxel&Flamingo, we use a four-layer model for connecting campaign KPIs to revenue across the brands we work with. We call it the Revenue Proof Chain, and the order matters as much as the layers themselves.
- Campaign Signal Layer: Clean, consistent channel data captured the same way across every platform: spend, impressions, clicks, platform-reported conversions. This is where most teams already live, and where most teams stop.
- Commercial Bridge Layer: A structured connection between campaign IDs and the CRM or finance system of record, so a lead or order can be traced back to the campaign that touched it without relying on a single platform’s version of events. Almost nobody builds this layer. It’s the one that makes everything above it usable.
- Business Outcome Layer: The numbers a board reads: revenue growth, contribution margin, CAC payback period, LTV to CAC ratio. Campaign data feeds this layer. It never gets presented on its own.
- Validation Layer: Periodic incrementality testing, geo holdouts, matched-market tests, or a lightweight MMM that checks whether the first three layers are telling the truth. Attribution without validation is just a story nobody has bothered to double-check.
This is what full-funnel marketing ROI looks like once it’s built, not just reported on. In the full-funnel campaigns Lyxel&Flamingo runs for brands across FMCG, BFSI, and D2C, the Commercial Bridge layer is consistently the one clients have skipped, and it’s the one with the fastest payback once it exists. Everything downstream of it gets easier the day it’s built, not the quarter after.
Want a similar playbook for proving ROI on a channel that keeps getting written off as “just a cost centre”? Read this blog: Your Website Is a Growth Engine, Not a Line Item: A CXO’s Guide to Web ROI
Four Things to Fix Before Your Next Budget Review
Good marketing performance metrics for CMOs don’t start with a tool. They start with a decision about which single number you’re willing to defend in front of the board, and that decision has to happen before any dashboard gets built.
- Pick one business metric before you pick a dashboard tool. Contribution margin per acquired customer works better than “engagement” ever will. Decide the metric first, then build reporting around it, not the other way round.
- Build a bridge table between campaign IDs and your CRM or finance IDs. It sounds unglamorous, and it is. It’s also the single highest-impact fix on this list, and most teams still haven’t done it.
- Run one incrementality holdout test this quarter. A geo holdout or matched-market test costs less than a single month of paid media, and it tells you whether your attribution model is describing reality or just repeating itself back to you.
- Get finance to agree on your ROI definition before the board does. If marketing and finance walk into a budget meeting with two different numbers for the same campaign, the board ends up trusting neither one. This single step does more for how to prove marketing ROI to leadership than any new tool will.
Conclusion
Campaign dashboards will keep getting prettier every year. None of it matters if the numbers on them can’t survive a finance review. The brands building a real translation layer between campaigns and the P&L now are the ones whose budgets survive the next downturn intact. Everyone else ends up negotiating from noise instead of proof, right when it matters most. Proving marketing ROI was never really about better reporting. It was always about building a chain of evidence that finance signs off on before marketing has to defend it.
Talk to Lyxel&Flamingo’s Full-Funnel Marketing team about a Revenue Proof Chain audit ahead of your next budget cycle.
Frequently Asked Questions
Marketing ROI measurement looks at the total return a business gets on its marketing investment, usually revenue or profit generated per rupee spent. Attribution is narrower: it only assigns credit for individual conversions to specific touchpoints. You need attribution data to build ROI measurement, but attribution on its own is not ROI.
A marketing attribution model works at the individual, user level and tries to credit specific touchpoints for a specific conversion. Marketing mix modelling works at the aggregate, market level and estimates how total spend across channels drove total business outcomes over time. MMM doesn't need individual-level tracking, which is exactly why it's resurging as privacy rules tighten.
Nobody has a perfect attribution setup, so stop waiting for one. Pick two or three business-outcome metrics finance already trusts, build the bridge between campaign data and those metrics, then validate the connection with one incrementality test. That combination convinces a board faster than a more detailed dashboard ever will.
Full-funnel ROI tracking earns its budget as soon as marketing spend reaches a level where one bad quarter would trigger a real conversation with the board, which for most mid-sized brands arrives earlier than they expect. Waiting until the board asks is already waiting too long.
It's worth it for mid-sized brands too, arguably more so now than before. Open-source tools such as Google's Meridian removed most of the cost barrier that used to make MMM an enterprise-only exercise. The remaining barrier is clean historical data, not budget.