
Blog Summary
Every brand’s topline climbs during festive week, discount or no discount, so gross revenue stops being useful exactly when leadership is paying it the most attention. Tracking the wrong number through Flipkart Big Billion Days and Amazon’s Great Indian Festival means finding out what the sale actually cost only after the quarter closes and the discount is long gone. This is the CXO dashboard Indian D2C brands and marketplace sellers use to catch a problem while there is still time to fix it, not read about it in a recap deck.
Table of Contents
- The Number That Flatters Everyone
- What Tracking the Right KPIs Actually Protects
- Contribution Margin Per Order: The Number That Survives the Discount
- Buy Box Win Rate: Visibility Measured Honestly
- Stock-Out Rate: The Ad Spend You Set on Fire
- Return-Adjusted Revenue: The Number That Arrives Last and Matters Most
- The Festive CXO Dashboard: Four Numbers That Decide Whether Festive Revenue Was a Win or an Expensive Illusion
- What the Dashboard Catches Before It Is Too Late
- The Question to Sit With
- Closing
The Number That Flatters Everyone
Every brand’s topline climbs in festive week. Discount hard enough and it climbs for anyone. That is not strategy, it is arithmetic, and a board that stops at gross sales is being told a story rather than shown a result. The story reads the same whether the quarter was profitable or not.
This is how festive weeks get called a success on the strength of one number, the same pattern “10 festive trends every brand should watch this season” flags across categories, while the numbers that would have said otherwise never made it to the slide.
What Tracking the Right KPIs Actually Protects
Tracking the right KPIs through festive is not a reporting exercise. It is how a CXO catches a stock-out, a margin leak or a Buy Box loss while the sale is still running, not two weeks later when the damage is already booked. The four numbers below are not an exhaustive list. They are the four that move fast enough during festive week to demand daily eyes, not a monthly rollup, the core of any marketplace analytics practice worth the name.
This dashboard is the measurement layer that sits on top of the festive readiness playbook, carried through to the numbers that decide whether that readiness actually paid off.
Contribution Margin Per Order: The Number That Survives the Discount
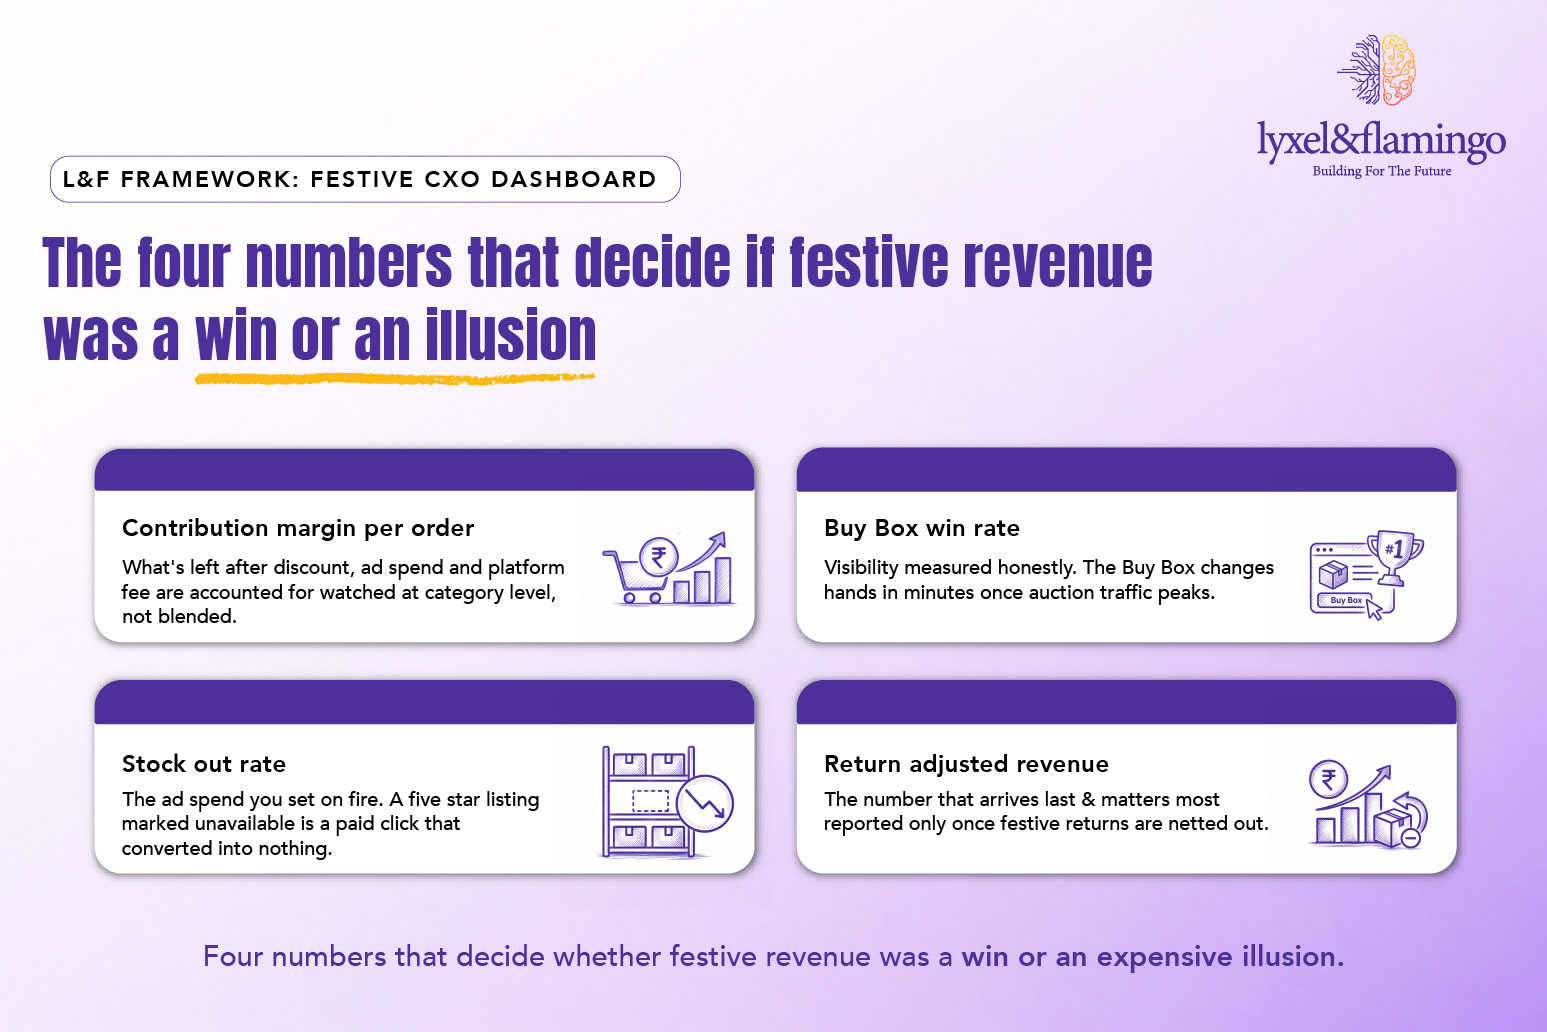
This is what is left after the discount, the ad spend and the platform fee are all accounted for. It is the only number on this list that actually answers whether the brand made money on a given order, and it should be watched at the category level, not just the blended average, because a blended number hides exactly the SKUs bleeding the most.
It is the same per-order economics worked through in “pricing and pack sizes built for the ten-minute cart”, just measured after the fact instead of designed in up front.
Buy Box Win Rate: Visibility Measured Honestly
Gross sales assumes visibility. Amazon Buy Box win rate proves it. Tracked hourly through peak traffic, not daily, because the Buy Box changes hands in minutes once the auction heats up, and losing it for even a few hours during the highest-traffic window of the year is a cost no recap deck ever quantifies correctly after the fact.
It is the same hour-by-hour vigilance that wins the ten-minute shelf in Winning on Blinkit, visibility that is won and lost by the hour, not the day.
Stock-Out Rate: The Ad Spend You Set on Fire
A five-star listing marked unavailable is a paid click that converted into nothing. ROAS collapses the moment the listing goes dark. Stock-out rate is the leading indicator that catches this while there is still time to reroute demand to an in-stock SKU, rather than discovering the gap in a post-sale inventory report.
Left unmanaged, this is exactly the failure “availability as marketing” warns against: an out-of-stock listing is the costliest advertisement a brand can run.
Return-Adjusted Revenue: The Number That Arrives Last and Matters Most
Festive returns run higher than any other quarter, and the true revenue number does not exist until they are netted out. Reporting gross revenue before returns land is not optimism, it is reporting a number the CXO already knows will shrink, and reporting it anyway.
The Festive CXO Dashboard: Four Numbers That Decide Whether Festive Revenue Was a Win or an Expensive Illusion
What the Dashboard Catches Before It Is Too Late
Kimirica‘s own festive dashboard makes the case. Sponsored Products and Sponsored Brands ran full funnel across Sept to Oct, segmented by ASIN performance and refined against competitor and price-parity filters. Total sales grew 47%. Orders climbed 69%. Ad sales rose 16% while CPC dropped 17%, and TACoS still improved by 12%, growth and efficiency moving together instead of trading off. That is the dashboard discipline this piece argues for, proven on a live Amazon account, not theorized. (L&F client work, Amazon, Sept-Oct 2024 versus Sept-Oct 2025.)
If you want a partner to help build and run this dashboard, our Third-Party Marketplace management services team does this every festive season.
The Question to Sit With
It is tempting to judge a festive sale by the number that lands on the board slide fastest. The sharper judge is whether that number would still look like a win after contribution margin, Buy Box performance, stock-outs and returns have all had their say. So the question worth carrying into the season is not whether festive revenue went up. It is whether you would still call it a win in January.
Closing
Building a festive dashboard that catches problems while they are still fixable is a discipline, and it is one Lyxel&Flamingo runs alongside CXO teams every season. If you want a clear read on which of your festive numbers are worth a daily look and which are safe to check weekly, our marketplace team can build that dashboard with you. Start that conversation with L&F →
Frequently Asked Questions
Because every brand's topline climbs in festive week, whether or not it's discounting. Gross sales stops being useful exactly when leadership is watching it most.
Contribution margin per order, Buy Box win rate, stock-out rate and return-adjusted revenue. These four move fast enough during festive week to need daily tracking rather than a monthly rollup.
Because the Buy Box changes hands in minutes once festive traffic peaks. A daily check can miss hours of lost visibility during the exact window that mattered most.
As soon as returns data allows, not before. Reporting gross revenue ahead of returns overstates a number the CXO already knows will shrink once festive returns land.