
What this blog covers
Standard 7-day click and 28-day view attribution windows assume a purchase cycle that festive season actively distorts, sometimes compressing it, sometimes stretching it. This covers where standard windows break down during Diwali-season shopping, and what to recalibrate before the board sees the numbers.
Quick Answer: Festive purchase cycles compress for impulse and gifting categories, where a 7-day window can miss conversions that used to take two weeks and now happen in three days, and stretch for considered, high-ticket categories, where shoppers research during the sale and buy weeks later. A single fixed attribution window applied across every category during festive season will misreport one direction or the other. Segment attribution windows by category purchase-cycle length before the season starts, not after the results look strange.
Table of Contents
Why Standard Windows Assume a Normal Month
A 7-day click and 28-day view attribution window is a reasonable default because it’s calibrated against an average purchase cycle across an average month. Festive season isn’t average. Search volume, discount depth and social proof all spike simultaneously, and that combination changes how long it actually takes someone to go from seeing an ad to buying. Google’s own conversion window documentation explains how window settings determine which conversions are recorded, which is exactly the assumption festive season challenges hardest.
Most teams don’t recalibrate the window itself, only the budget. That’s the gap: the measurement system stays static while the thing it’s measuring changes shape underneath it, even though Google’s attribution reporting documentation makes clear how conversion windows and lookback settings affect the credit assigned to interactions.
Compression: When 7 Days Is Too Long
For impulse categories and gifting-driven purchases, festive urgency compresses the decision cycle. A shopper who might normally take two weeks to decide on a gift moves in two or three days once a countdown timer and a limited-time discount are both visible. In this case, a 7-day window isn’t wrong, it’s actually generous, and the real risk is over-crediting a channel for a decision that was already made before the last touchpoint in the window. The same compression shows up in Performance Max bidding during Q4, where automated bidding can over-credit a channel for a decision the shopper had effectively already made days earlier.
Stretch: When 28 Days Is Too Short
For considered and high-ticket categories, the opposite happens. A shopper researches heavily during the peak sale days, adds to cart, then waits for a second discount event, a salary date, or simply more certainty before completing the purchase. If that gap exceeds 28 days, which is common for electronics and big-ticket home categories during an extended festive period spanning Navratri through Diwali, standard view-through attribution misses the connection entirely and under-credits the campaign that actually started the decision. This is the same measurement gap covered in The New Attribution Stack: Blending MMM, Incrementality, and Platform Signals: a single-window model can’t hold both a 3-day impulse cycle and a 45-day considered-purchase cycle at the same time.
The Festive Attribution Calibration Framework
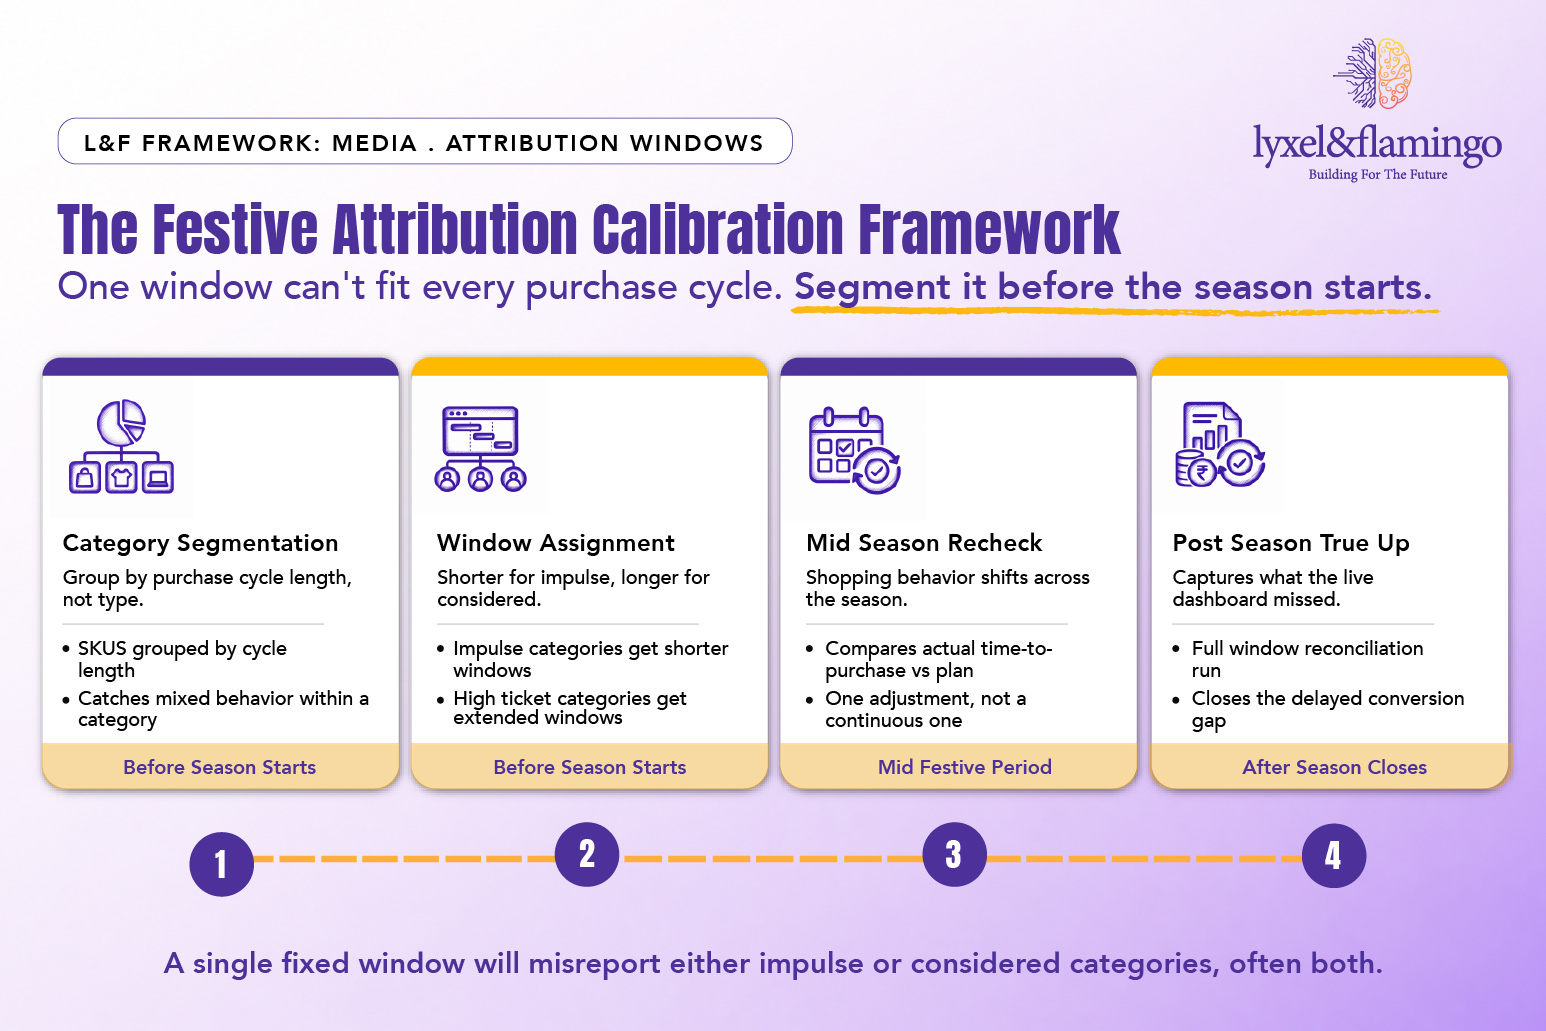
Framework Explained
Category Segmentation: Grouping by purchase-cycle length rather than product category catches cases where two products in the same category behave completely differently under festive urgency.
Window Assignment: This is the core fix, an impulse category needs a shorter window to avoid over-crediting, a considered category needs a longer one to avoid under-crediting.
Mid-Season Recheck: Festive shopping behavior itself shifts across the season, from early-bird deal hunting to last-minute gifting, so a single assignment made in September may need a small adjustment by the third week of the sale period.
Post-Season True-Up: The live dashboard during the season will always undercount delayed, considered-purchase conversions; the true-up run closes that gap for the final reported numbers.
What to Show the Board Instead
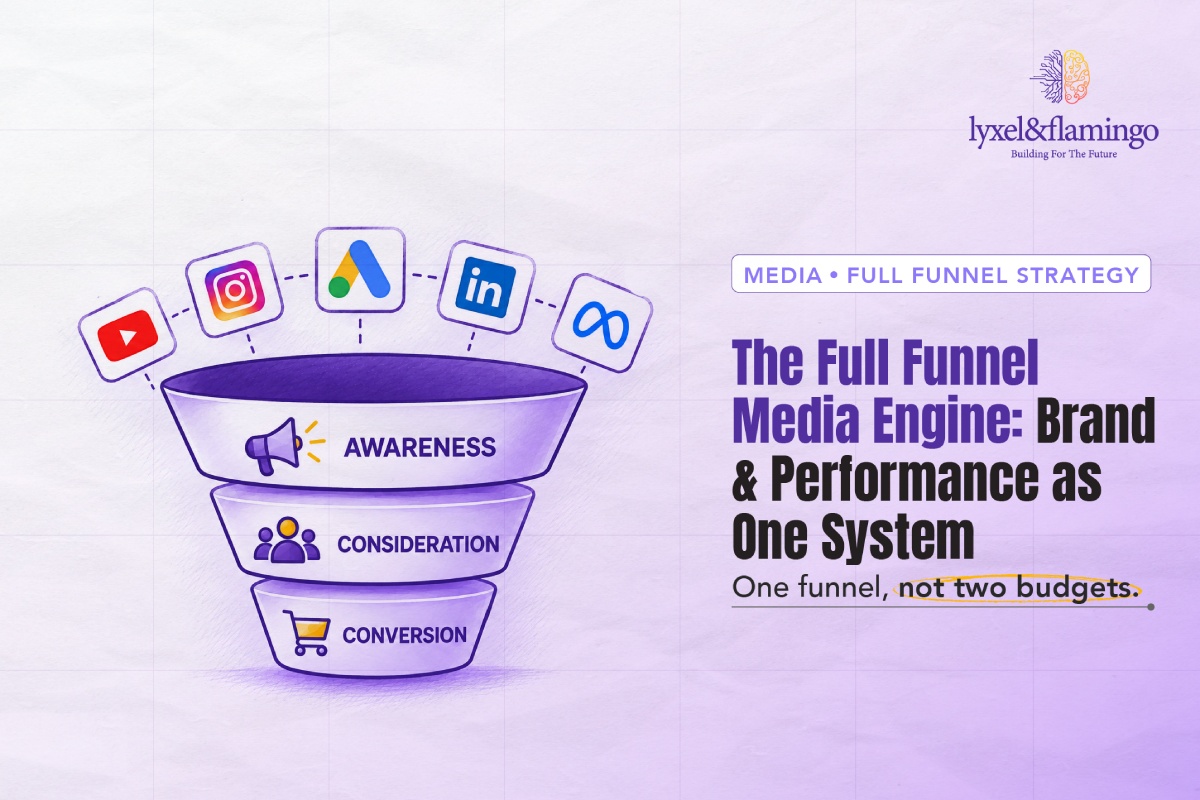
A single blended ROAS number hides which direction the attribution error is running. Showing category-segmented attribution, even just impulse versus considered as a first cut, gives the board a materially more honest read on what actually drove the festive spike. This is the same blind spot covered in The Full-Funnel Media Engine: Why Brand and Performance Are One System: a board shown one blended number can’t tell whether brand or performance is actually driving it.
Pairing that with the post-season true-up figure, clearly labeled as the reconciled number versus the live-season estimate, prevents the awkward conversation where October’s dashboard and November’s finance reconciliation don’t match and nobody can explain why.
Recalibrating Before, Not After
The fix has to happen before the season starts. Recalibrating attribution windows in the middle of a live festive campaign means comparing two different measurement systems across the same period, which makes the data harder to trust, not easier. The same discipline applies to mid-quarter media budget reallocation: a measurement change mid-flight and a budget shift mid-flight create the same kind of noise when neither is planned for in advance.
✓ CLIENT PROOF POINT IndiGo’s media operations work with Lyxel&Flamingo delivered more passengers, a lower customer acquisition cost and higher revenue, a result that depended on attribution discipline built for travel’s genuinely long and variable purchase cycle rather than a generic default window.
The same discipline shows up across categories with very different purchase cycles: Blackberrys’ media operations work with Lyxel&Flamingo and RupeeRedee’s app growth campaign both depended on measurement built for how that specific customer actually behaves, not a generic default window applied across every category.
Key Takeaways
- A single fixed attribution window will misreport either impulse or considered categories during festive season, often both.
- Impulse and gifting categories compress the purchase cycle; considered and high-ticket categories stretch it.
- Segment attribution windows by category purchase-cycle length before the season starts, not mid-season.
- Run a post-season true-up to capture delayed conversions the live dashboard missed.
CXO Takeaway
A board asking why the live festive dashboard and the post-season reconciliation don’t match is really asking whether the attribution model fit the purchase behavior it was measuring. Recalibrating category-level windows before the season starts is cheaper than explaining the gap after.
If your dashboard’s festive numbers and your finance team’s reconciled numbers don’t match, is that a performance problem, or a measurement one?
Talk to Lyxel&Flamingo about building category-segmented attribution windows that hold up under festive-season purchase behavior, not just an average month.
Frequently Asked Questions
They’re calibrated for an average month’s purchase cycle, and festive urgency, discount depth and extended sale periods change how long that cycle actually takes, in different directions for different categories.
Impulse and gifting-driven categories, where festive urgency compresses a normally slower decision into a few days, meaning even a 7-day window can be more generous than necessary.
Considered and high-ticket categories, especially electronics and big-ticket home goods, where shoppers often research during peak sale days, completing the purchase weeks later.
Before the season starts. Changing the measurement model mid-campaign makes it harder to compare results across the period, not easier.