
What This Blog Covers
Every headless commerce pitch leads with flexibility. Almost none of them show you the invoice for what that flexibility actually costs before it starts paying you back. Headless architecture is usually sold on speed and flexibility. The number a CFO actually wants is payback timing. This breaks down where headless commerce ROI shows up in year one, where it doesn’t, and how to model the decision honestly before committing budget.
Quick Answer: Most enterprises see headless commerce ROI in three places within year one: page speed improvements that lift conversion by low single digits, faster time-to-market on new campaign pages, and reduced developer hours on routine front-end changes. Full platform payback, accounting for the higher upfront build cost, typically lands between 14 and 20 months, not year one. Anyone promising a year-one full payback is either underselling the build cost or overselling the gains.
Table of Contents
What “Headless” Actually Changes
Headless architecture separates the front-end presentation layer from the back-end commerce engine, connected through APIs instead of a single monolithic platform. That separation is what allows a marketing team to launch a new campaign landing page without touching checkout, inventory or the core commerce logic underneath it.
The trade-off is upfront complexity. A headless build needs a front-end framework decision, API integration work, and usually a larger initial development team than a monolithic platform would require, before any of the flexibility benefits start showing up in daily operations.
Where the Return Shows Up First
Page speed is the most immediately measurable gain. Decoupling the front end typically cuts load times meaningfully, and that speed improvement has a direct, well-documented relationship to conversion rate, usually in the low single digits per second of improvement, not a dramatic jump.
Time-to-market on new pages is the second early return. A marketing team that used to wait on a development sprint to launch a new landing page can often self-serve through a headless CMS layer instead, cutting a two-week turnaround down to days.
Developer hours on routine changes is the third. Once the initial integration work is done, front-end changes that used to require touching the core platform become isolated, faster, and lower-risk, freeing engineering time for higher-value work.
Where It Doesn’t Pay Back Quickly
The initial build cost is real and it’s front-loaded. A headless migration typically costs more upfront than a comparable monolithic platform implementation, because the team is building integration layers that a monolithic platform provides out of the box.
Organizational readiness is the less obvious cost. A headless architecture assumes a team that can maintain API integrations and a decoupled front end, which is a different skill set than managing a single platform’s admin panel. Underestimating this is the most common reason a headless project’s timeline slips past its projected payback point.
The payoff shows up fastest under pressure, not on an ordinary Tuesday. A decoupled front end is exactly what lets a team isolate and fix the checkout bottleneck covered in why your checkout flow fails at 3x normal traffic without touching the core commerce logic underneath it, the kind of festive-season stress test a monolithic platform makes far more disruptive to run.
The Headless ROI Timeline Framework
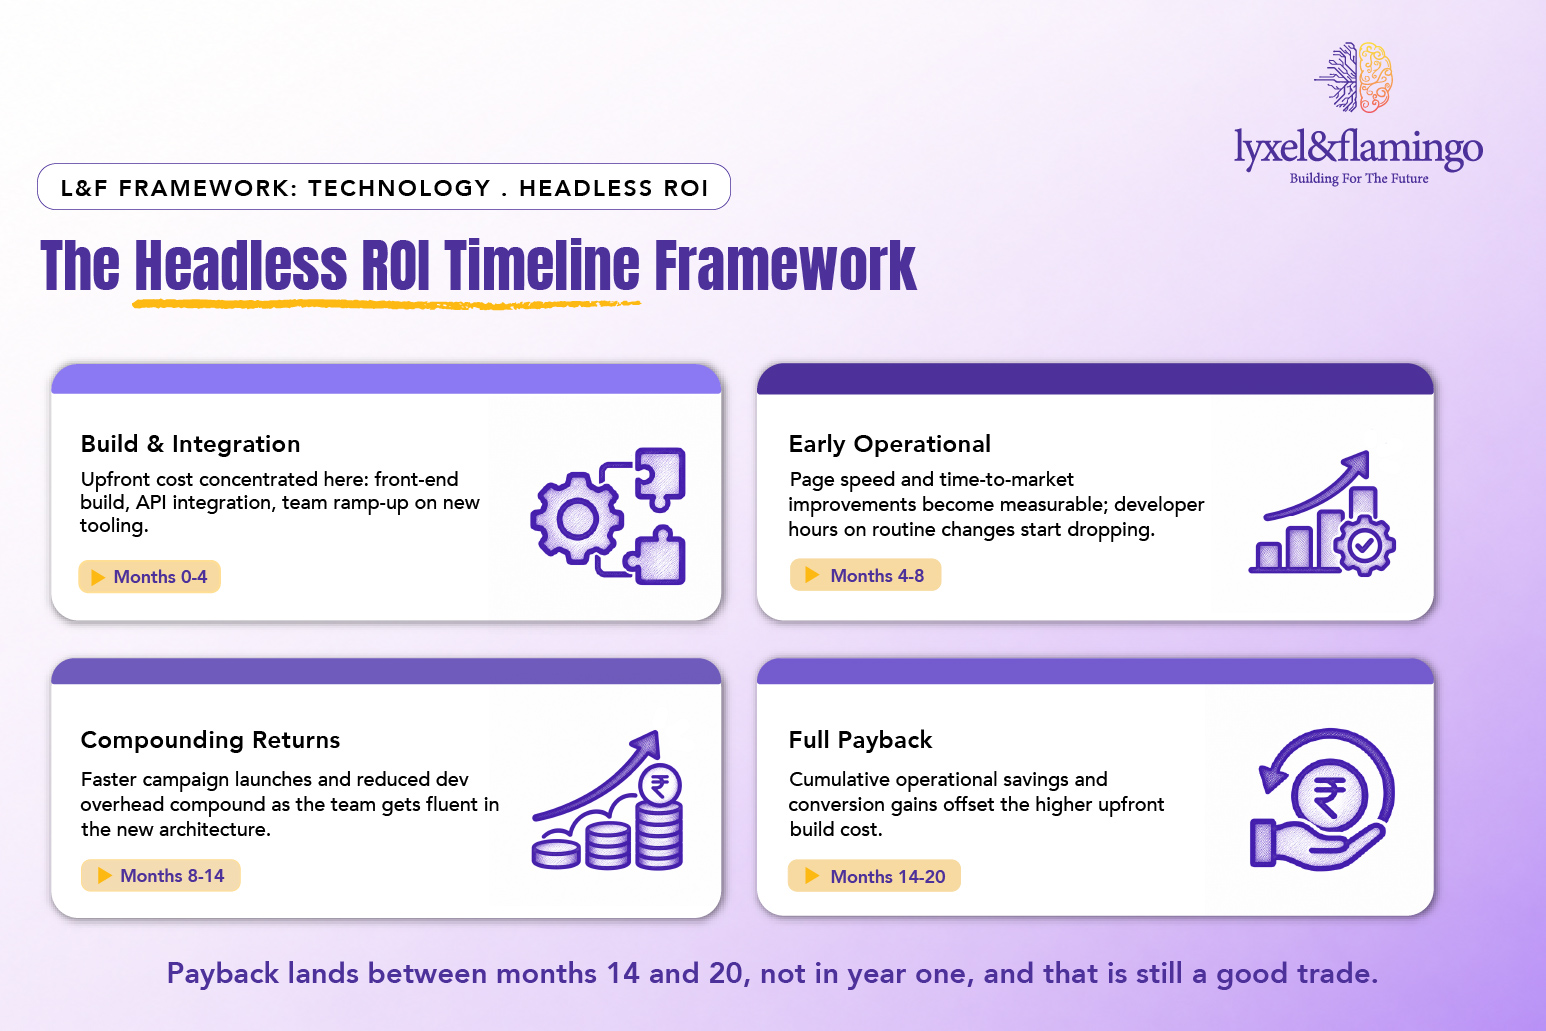
Framework Explained
- Build & Integration: This phase is where most of the cost sits, and treating it as a sunk cost rather than a phase with its own timeline is how a headless project’s total ROI gets misjudged from the start.
- Early Operational Gains: Page speed and time-to-market are the first visible wins, modest individually; the value compounds rather than arrives all at once.
- Compounding Returns: This is where a headless build starts distinguishing itself from a monolithic one, since the team’s growing fluency with the new architecture keeps reducing the marginal cost of each new change.
- Full Payback: 14 to 20 months is a realistic range for most enterprise builds; a timeline promising full payback inside year one usually means the build cost was underestimated or the operational gains were overestimated.
Modeling the Decision Honestly
The honest model compares total cost of ownership over a full 24-month window, not just the build quote against the platform license fee. That means including the cost of the new skill set the team needs, not just the API integration work itself.
It also means being explicit about which gains are conversion-driven (harder to attribute cleanly) versus operational (easier to measure directly in developer hours saved). A CFO evaluating this decision will trust the operational numbers more readily than the conversion-lift estimate, and the model should lead with what’s actually provable.
What a Real Year-One Build Looks Like
Coffee Island’s full-stack app and web build with Lyxel&Flamingo supported the brand’s expansion into new markets, the kind of build where the front-end flexibility headless architecture provides matters most: launching market-specific experiences without rebuilding the underlying commerce logic for each new region.
That’s the practical version of the ROI case, not a speed benchmark in isolation: the ability to expand without the back-end rebuild that a monolithic platform would have required.
The existing headless commerce for enterprises: speed, flexibility, and global scale post covers the architectural case for making this move. This one is the financial case for when it’s worth making.
Key Takeaways
- Realistic headless commerce payback lands between 14 and 20 months, not inside year one.
- Page speed, time-to-market, and developer hours are the three earliest measurable returns.
- The upfront build cost and the organizational skill-set shift are both real costs, often underestimated.
- Model total cost of ownership over 24 months, and lead with operational savings over conversion-lift estimates when making the case internally.
CXO Takeaway
Approve a headless migration on a realistic 14 to 20 month payback timeline, not a vendor’s best-case year-one projection. The architecture case and the financial case are both sound. Only one of them is usually presented honestly in a sales pitch.
If your team is evaluating headless commerce, has anyone modeled the 24-month total cost of ownership, or just the build quote?
Talk to Lyxel&Flamingo about modeling a realistic headless commerce ROI timeline before committing budget to the build.
Frequently Asked Questions
Most enterprise builds see full payback between 14 and 20 months, once the upfront build cost is offset by operational savings and conversion gains. Year-one full payback is uncommon.
Page speed improvement is usually the earliest measurable gain, with a direct, modest relationship to conversion rate, followed by faster time-to-market on new campaign pages.
Organizational readiness. Maintaining API integrations and a decoupled front end requires a different skill set than managing a monolithic platform, and underestimating that is the most common cause of timeline slippage.
Operational savings, measured in developer hours, are easier to attribute cleanly and more likely to be trusted by finance than a conversion-lift estimate, which has more variables involved.