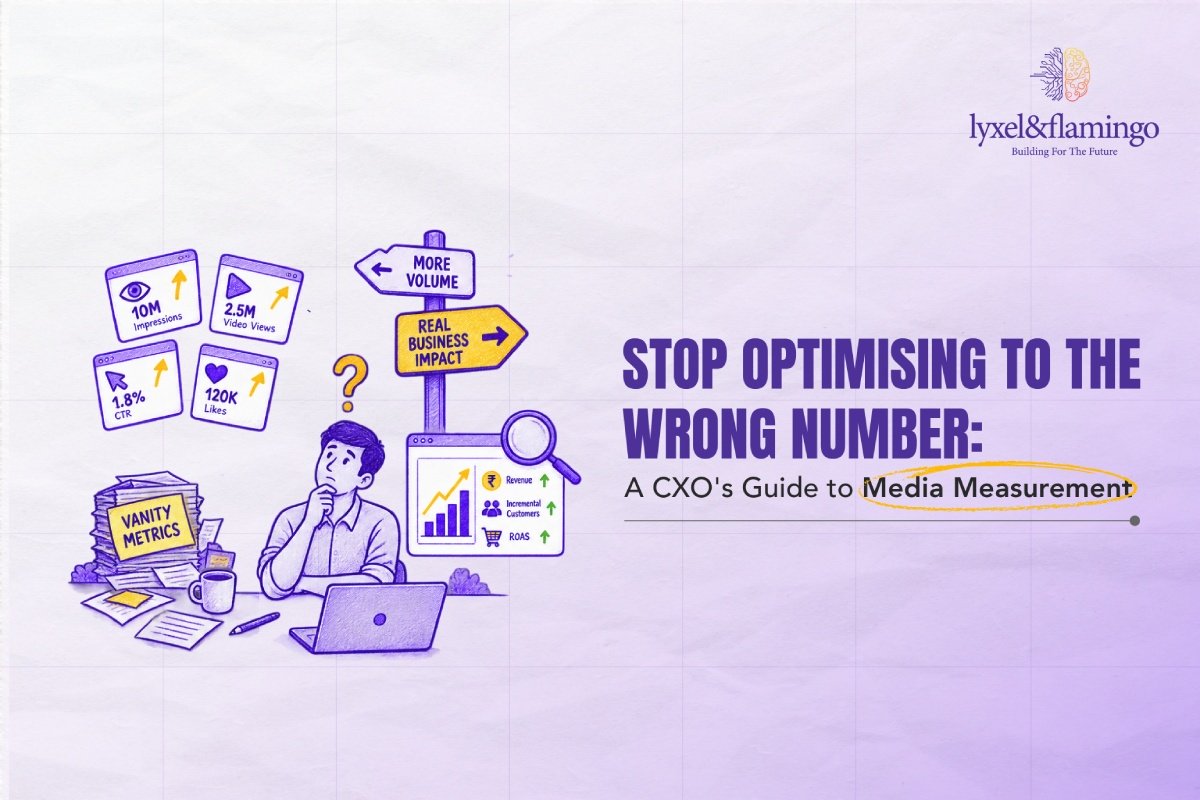

What this blog covers
This blog compares the three efficiency metrics that run most marketing teams ROAS, MER, and contribution margin and settles which should lead. It defines each, shows what it measures and where it goes blind, sets out which decision each is built for, and gives a clear rule for how they should stack. It closes with a self-check and the questions leaders ask most.
Table of Contents
- Hitting the target and missing the point
- ROAS: the campaign metric
- MER: The engine metric
- Contribution margin: The profit metric
- The three side by side
- Which should lead and how they stack
- What the metric you lead with builds
- Self-check: Is the right metric leading?
- Key takeaways
- Closing
- Want the right metric leading your decisions?
Hitting the target and missing the point
A team can meet its ROAS target every single month and watch the business flatline. It happens because ROAS answers a narrow question: how much revenue a campaign is credited with per rupee of ad spend and a brand is far more than a collection of campaigns. Steer the whole business by a campaign-level, revenue-level number, and you optimise for something other than profit, often without noticing until the annual accounts arrive.
The way out is to be clear about what each metric measures and to lead with the right one. ROAS, MER and contribution margin are all efficiency metrics, and all useful, but they sit at different levels and answer different questions. Understanding how they relate is the difference between an efficient-looking dashboard and a profitable business.
ROAS: the campaign metric
Return on ad spend is the revenue credited to a campaign divided by the amount spent on that campaign’s ads. It is granular, fast, and available inside every ad platform, which is why it dominates day-to-day optimisation. For deciding whether one lower-funnel activity is pulling its weight, it does the job well.
Its limits come from what it leaves out. ROAS is usually platform-reported and last-click-leaning, so each platform claims credit for the same sales and the numbers add up to more than the business actually made. It sits at the revenue level, so it says nothing about the cost of the product behind that revenue. And because it is campaign-level, it is blind to how channels assist each other and to the brand-building that made the conversion cheaper. ROAS is a useful instrument for a narrow question; the trouble starts when it is asked to run the whole business.
MER: The engine metric
Marketing efficiency ratio, or MER, is total revenue divided by total marketing spend across everything. Because it is blended, it sidesteps the double-counting problem of platform-reported ROAS: there is only one total revenue and one total spend, so no channel can claim a sale twice. That makes it a far better measure of how the whole marketing engine is performing, and a more honest number to steer overall efficiency by.
MER still sits at the revenue level, though. It tells you how much revenue your total marketing produces per rupee, but not how much profit is left after the cost of goods. It is the right metric for judging the health of the engine and for spotting when overall efficiency is drifting, and it deserves to sit above ROAS in the reporting hierarchy but it is an input to the profit view rather than the profit view itself.
Contribution margin: The profit metric
Contribution margin goes a step further than the other two do not: it subtracts the cost of goods and the other variable costs of the sale discounts, fees, shipping, returns to show the profit each rupee of media actually leaves behind. It is the number the business banks, and the one that reflects the full economics of growth. Reading media this way is the heart of a media P&L, and it is what stops a brand from scaling revenue while quietly shrinking profit.
Contribution margin is slower to read than ROAS, because it needs finance data rather than platform data, and it is less granular. That is the price of accuracy. For the decisions that matter most what to scale, what to cut, whether growth is actually paying it is the metric that tells the truth.
The three side by side
Laid out together, the three metrics form a hierarchy rather than a menu.
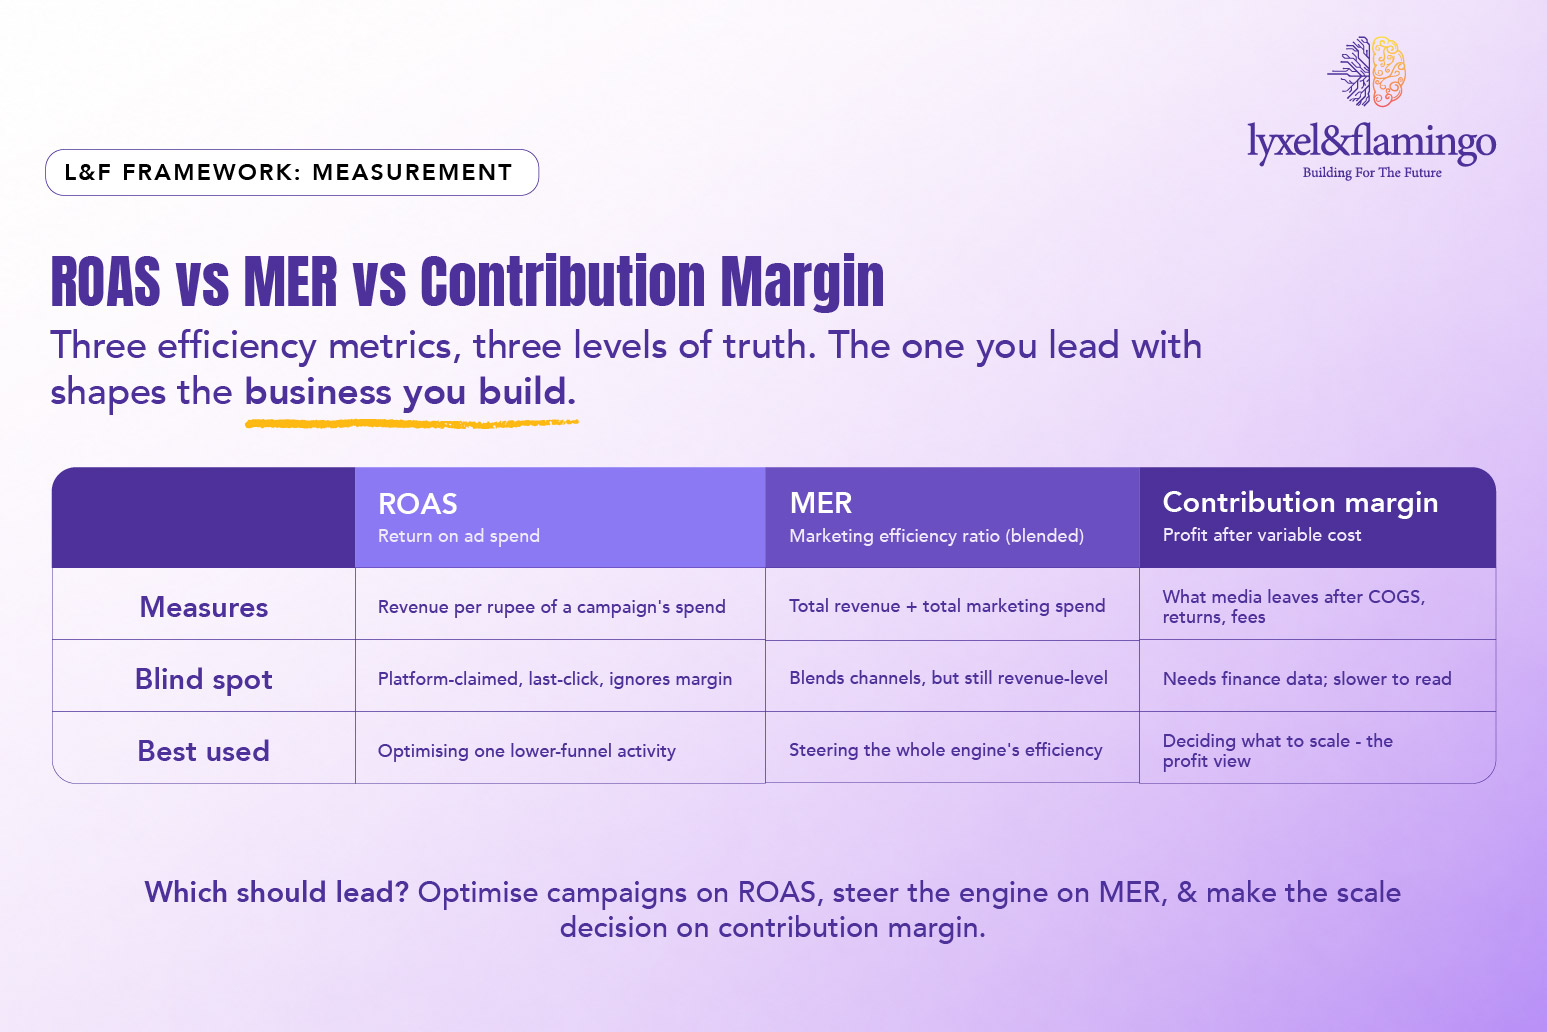
Framework: ROAS vs MER vs Contribution Margin three levels of truth about the same spend.
ROAS measures a single campaign’s revenue efficiency and is quick but narrow. MER measures the whole engine’s revenue efficiency and is blended and honest, but still revenue-level. Contribution margin measures the profit left after every variable cost and is the slowest to read but the closest to what the business actually keeps. Each has a blind spot the next one up corrects, which is why the answer to which should lead is really about how they stack.
Which should lead and how they stack
The rule is straightforward: optimise campaigns on ROAS, steer the engine on MER, and make the decisions that matter on contribution margin. Day to day, a performance team uses ROAS to tune individual activities. Weekly, leadership watches blended MER to see whether the engine’s efficiency is holding. And when the question is what to scale or whether growth is profitable, contribution margin leads – the discipline of looking beyond ROAS to the profit line. Contribution margin sits at the top not because the other two are wrong, but because it is the only one that carries every cost through to what the business keeps.
What the metric you lead with builds
The metric a team leads with quietly shapes the business it builds, because people optimise for whatever they are measured on. Lead with campaign ROAS and a team gravitates toward demand-harvesting activities that post the cleanest returns, under-investing in the demand creation that has no last-click number and the business slowly narrows to whatever converts today. Lead with MER and the team protects the health of the whole engine, but can still scale thin-margin revenue that looks efficient. Lead with contribution margin and the team optimises for profit, which is usually what leadership actually wants.
The proof shows up in the decisions. Shawarmer improved ROAS by 23% on 34% lower spend by tightening measurement and cutting waste a decision that only makes sense when profit, not revenue, is the goal. GoMechanic grew purchase volume 221% while cutting cost per purchase 47%, growth and efficiency together because the measurement protected margin. In both, leading with the profit view produced a better decision than the revenue view would have.
Self-check: Is the right metric leading?
Score your own reporting one point per yes:
- Leadership decisions are made on contribution margin, not ROAS alone
- You use blended MER, not summed platform ROAS, to judge overall efficiency
- ROAS is used to optimise campaigns, not to steer the business
- You know your margin by product or category, not just a blended average
- Platform-reported numbers are treated as claims to verify, not facts
- Finance and marketing agree which metric leads the decision
- Scaling decisions test whether the next rupee still leaves margin
Five or more and the right metric is leading. Three or fewer and a campaign number is probably steering the business.
Key takeaways
- ROAS, MER and contribution margin are all efficiency metrics, but they answer different questions at different levels.
- ROAS is campaign-level and revenue-level, useful for optimisation, misleading as a north star.
- MER is blended and honest about double-counting, but still stops at revenue.
- Contribution margin carries every cost through to profit – the number the business actually banks.
- Optimise on ROAS, steer on MER, and make the decisions that matter on contribution margin.
Closing
Every efficiency metric is a lens, and every lens is honest about something and blind to something else. Using ROAS is fine; the mistake is letting a campaign-level revenue metric run a whole business. Stack the three in the right order: ROAS for tuning, MER for steering, contribution margin for deciding – and the dashboard stops flattering and starts guiding. The number you lead with is a choice about the business you are building, so it is worth making that choice on purpose.
Want the right metric leading your decisions?
L&F builds the measurement hierarchy: ROAS for optimisation, MER for steering, contribution margin for the decisions that matter – for consumer brands across India and worldwide. We will get the right number to the top of your dashboard. Talk to L&F about measurement and lead with the metric that reflects profit.
Frequently Asked Questions
ROAS (return on ad spend) is the revenue credited to a specific campaign divided by that campaign's ad spend granular and platform-reported, but prone to double-counting when every platform claims the same sale. MER (marketing efficiency ratio) is total revenue divided by total marketing spend across everything blended, so no channel can claim a sale twice. ROAS is best for optimising one activity; MER is the more honest measure of how the whole engine is performing.
Contribution margin is the profit each rupee of media leaves after subtracting the cost of goods and other variable costs discounts, fees, shipping, returns. ROAS stops at revenue and ignores those costs, so a high ROAS can sit on a product that loses money per unit. Contribution margin is slower to read because it needs finance data, but it reflects what the business actually keeps, which makes it the right metric for scale and profit decisions.
Use all three, in a hierarchy. Optimise individual campaigns on ROAS, steer the overall engine's efficiency on blended MER, and make the decisions that matter what to scale, whether growth is profitable on contribution margin. Leading with the wrong one distorts behaviour: campaign ROAS pushes teams toward demand harvesting, while contribution margin keeps them optimising for profit. The rule is ROAS to tune, MER to steer, margin to decide.
Because ROAS measures revenue, not profit, and at the campaign level. A brand can hit a strong ROAS on products with thin margins, or on demand it was going to capture anyway, and still lose money once cost of goods, discounts, shipping and returns are counted. Summed platform ROAS also double-counts sales. Only a profit-level metric like contribution margin, on a blended basis, shows whether the business is actually making money.
There is no universal figure a healthy MER depends on your margins, category and growth stage. A high-margin brand can sustain growth at a lower MER than a thin-margin one. Rather than chase a benchmark, track your own MER over time and against your contribution margin: the useful question is whether your blended efficiency is holding as you scale, and whether the revenue it reflects is actually leaving profit once costs are counted.
No ROAS is a useful instrument for the job it is built for: judging whether a specific lower-funnel activity is performing, day to day. The problem is only using it as the single north star for the whole business. Keep ROAS for campaign optimisation, add blended MER to judge overall efficiency honestly, and lead the big decisions with contribution margin. It is about giving each metric the right role, not discarding any of them.
Each ad platform attributes conversions using its own, often last-click-leaning logic, and claims credit for sales it may have only partly influenced. Add up what every platform reports and you will appear to have made more sales than you actually did. That is why summed platform ROAS overstates efficiency, and why a blended, independent view MER for the engine, contribution margin for profit - is needed to see the real picture.