
What this blog covers
This blog explains share of search the proportion of category search demand that goes to your brand and why it works as an early read on market share. It covers how to calculate it, the evidence that it leads rather than lags, how to read it correctly, the mistakes that turn it into noise, and where it belongs on a leadership dashboard. It closes with a self-check and the questions leaders ask most.
Table of Contents
- A metric hiding in plain sight
- What share of search is
- Why it predicts market share
- The Share-of-Search Predictor, in practice
- How to read it without fooling yourself
- Where it earns a place on the dashboard
- Self-check: Are you using share of search?
- Key takeaways
- Closing
- Want share of search working as an early read on your market position?
A metric hiding in plain sight
Market share is one of the most important numbers a brand can track, and one of the slowest to arrive. It comes from panels and syndicated data, weeks or months after the quarter it describes, by which point the decisions that shaped it are long made. Leaders are left steering by a rear-view mirror, learning whether they gained or lost ground well after they could have done anything about it.
Share of search offers an early read on the same question, available continuously and for the cost of a search-trends tool. It is the everyday cousin of the branded search signal, extended across the whole category, and it has a useful property that panel data does not: it moves first. Watched over time, it tells a leadership team where market share is heading while there is still room to act.
What share of search is
Share of search is your brand’s proportion of all the branded search demand in your category. You take the search volume for your own brand terms, then divide it by the combined search volume for your brand plus every meaningful competitor’s brand terms. The result is a percentage: your slice of the category’s search attention. If people searching the category are increasingly typing your name rather than a rival’s, your share of search is rising.
The reason it maps to market share is that a branded search is an act of intent. When someone searches your brand by name, they have already moved from unaware to interested and are leaning toward you specifically. Aggregate that across a category and the pattern of who people are searching for is a live picture of where preference sits, and preference is what market share is made of.
Why it predicts market share
The relationship between share of search and market share is one of the more robust findings in modern marketing measurement, popularised through the work of Les Binet: across many categories, share of search tracks market share closely, and changes in share of search tend to lead changes in market share rather than follow them (IPA (Binet & Field)). A brand whose share of search is climbing is usually a brand about to gain market share; one whose share of search is sliding is often losing ground before the sales data shows it.
The lead time is what makes it valuable. Because searching precedes buying often by weeks in considered categories, a shift in share of search is an early warning. It gives a leadership team the chance to respond to a competitor’s move, or to see the effect of their own brand-building, long before the market-share report confirms it. That head start is precisely what a rear-view metric cannot offer.
Related blog: How SEO and PR Work Together to Increase Branded Searches, on building the branded-search demand this metric depends on.
The Share-of-Search Predictor, in practice
The framework is a single equation and a way of reading it over time.
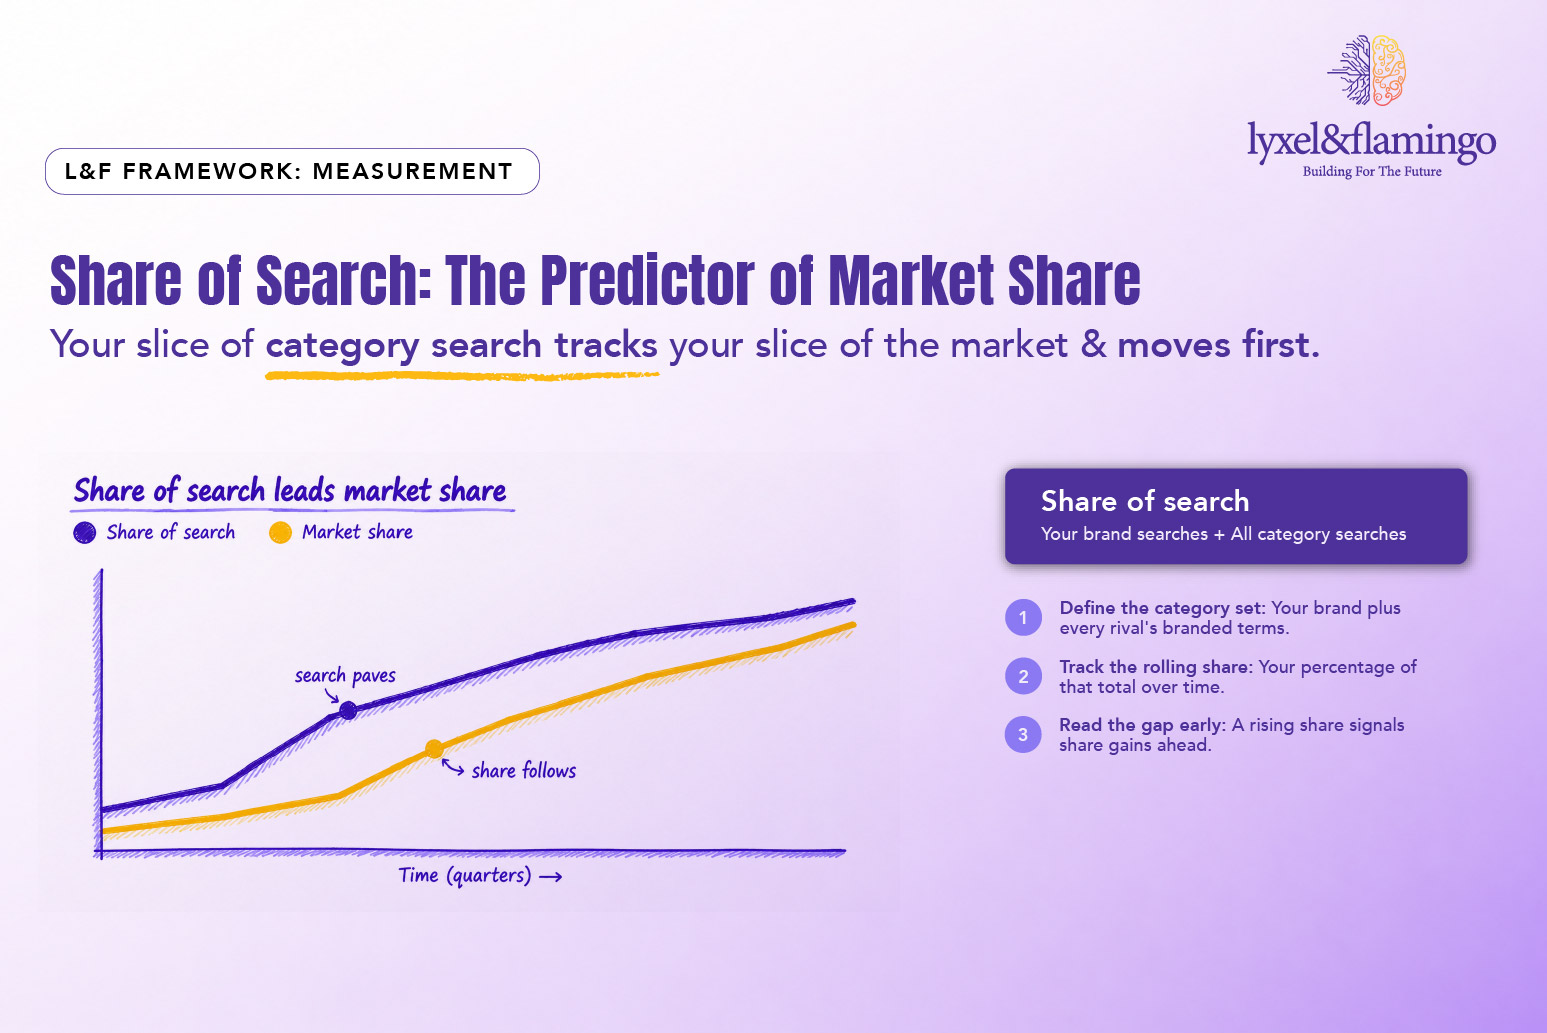
Framework: Share of Search your brand searches divided by category searches, read as a leading indicator.
The chart shows the pattern that makes it useful: the share-of-search line bends before the market-share line, so reading it as a trend gives an early view of the direction of travel. In practice, you define the category set your brand plus every rival that matters track your rolling share of that total, and watch the gap. A rising share signals share gains ahead; a falling one is a prompt to look at what is happening upstream in your brand-building before the sales line reacts.
How to read it without fooling yourself
Share of search rewards careful reading and punishes careless reading. A few disciplines keep it honest. Build the category set deliberately, including the competitors that genuinely compete for the same demand, and revisit it as the market changes; a set that misses a fast-rising challenger will flatter your share. Read a rolling trend rather than daily figures, because day-to-day search is noisy and only the direction over weeks carries meaning. Separate branded terms from generic category terms, since only branded search reflects preference for a specific brand. And account for seasonality and one-off spikes: a viral moment or a product recall can move search sharply without reflecting a durable shift in preference. Read as a seasonally aware trend against a well-chosen category set, share of search is dependable; read raw and daily, it can mislead.
Where it earns a place on the dashboard
Share of search belongs on the leadership dashboard, next to revenue and market share, not buried in a search report. Presented as a rolling trend against the category, it gives leaders an early read on competitive position and on whether brand-building is working weeks before the panel data arrives. It sits naturally alongside the other leading signals in a modern measurement framework, and it pairs especially well with brand search and content work, since the two reinforce each other.
Related blog: How to Improve Brand Search Volumes, the tactical companion piece for growing the branded search this metric tracks.
Self-check: Are you using share of search?
Score your own operation one point per yes:
- You track your brand’s share of category search, not just your own volume
- The category set includes every competitor that matters, and is kept current
- You read a rolling trend, not daily numbers
- Branded terms are separated from generic category terms
- You adjust for seasonality and one-off spikes before drawing conclusions
- Share of search sits on the leadership dashboard next to market share
- A falling share triggers a brand-building review, not just a search audit
Five or more and share of search is working as an early-warning system. Three or fewer and you are leaving a leading indicator unread.
Key takeaways
- Market share arrives late; share of search offers an early read on the same question, continuously and cheaply.
- Share of search is your brand’s slice of total category branded search, an aggregate signal of preference.
- Across many categories, it tracks market share and tends to move ahead of it, giving a genuine lead time.
- Read it as a rolling trend against a well-chosen category set, adjusted for seasonality, to keep it reliable.
- Put it on the leadership dashboard next to market share; a falling line is a prompt to look at brand-building.
Closing
Most leadership teams accept that they will learn their market share after the fact, and plan around the lag. Share of search quietly removes that excuse. It is sitting in a free tool; it moves before the sales data, and it answers the question leaders care about most – are we gaining ground or losing it while there is still time to change the answer. The brands that read it well are watching the road ahead while their rivals study the mirror.
Want share of search working as an early read on your market position?
L&F builds the leading-signal view of share of search, branded search, and the metrics that move first into the measurement stack, for consumer brands across India and worldwide. We will set up the reading and tie it to your category. Talk to L&F about demand signals and watch the road ahead, not the mirror.
Frequently Asked Questions
Share of search is your brand's proportion of all the branded search demand in your category. You divide the search volume for your own brand terms by the combined search volume for your brand plus every meaningful competitor's brand terms, giving your percentage of the category's search attention. It is treated as an aggregate signal of preference, because a branded search is an act of intent toward a specific brand.
Take the search volume for your brand terms over a period, and divide it by the total search volume for all the brands in your category set (yours plus competitors), for the same period. Express it as a percentage and track it over time. The two decisions that matter most are choosing the right category set the competitors that genuinely compete for the same demand and reading a rolling trend rather than daily figures.
The evidence, popularised by Les Binet, is that across many categories share of search tracks market share closely and changes in share of search tend to lead changes in market share rather than follow them. It is a strong indicator rather than a guarantee the relationship is tighter in some categories than others but as an early, continuous read on competitive position, it is one of the most useful leading signals available.
Branded search volume is the raw count of searches for your brand a measure of your own demand. Share of search puts that number in competitive context by expressing it as a proportion of the whole category's branded search. Branded search tells you whether your demand is growing; share of search tells you whether you are gaining or losing ground relative to competitors, which maps more directly to market share.
Include the competitors that genuinely compete for the same demand as you, and revisit the set as the market changes. A set that is too narrow flatters your share; one that misses a fast-rising challenger hides a real threat. Focus on branded terms for each competitor, keep the set consistent enough to compare over time, and update it deliberately when a new entrant starts to matter.
Track it continuously but read it as a rolling trend typically a four-week or quarterly view rather than reacting to daily numbers, which are noisy. The value is in the direction of travel over time and in catching an inflection early. Reviewing the trend monthly, against your media and competitive activity, is enough for most brands to act on a shift before the market-share data confirms it.
Yes, if read carelessly. A poorly chosen category set, mixing branded and generic terms, ignoring seasonality, or over-reading a one-off spike from a viral moment or a recall can all distort it. It also reflects search behaviour specifically, which is a strong but not perfect proxy for the whole market. Read as a seasonally aware rolling trend against a well-chosen category set, it is dependable; read raw, it can mislead.