
Blog Summary
On a Monday review, a quick commerce dashboard can glow with good news: impressions up, clicks up, order value up, while the finance line quietly reports that the channel lost money last month. Quick commerce is generous with numbers, and that generosity is the trap. This is a guide to the handful of measures that actually tell a brand whether it is winning on the ten-minute shelf, and the loud ones worth ignoring.
Table of Contents
The Dashboard That Says Everything Is Fine
Picture the Monday growth review. The screen is a wall of green: impressions climbing, clicks climbing, gross order value climbing, and the room feels good about the quarter. Then the finance partner opens a second tab, and the channel that looked like a triumph turns out to have lost money over the same weeks. Nobody in the room was lying. They were simply watching the numbers that are easiest to grow, which are rarely the numbers that decide whether the business works.
Quick commerce produces an unusual amount of data, and much of it moves in the flattering direction almost on its own. Spend more and impressions rise. Discount harder and clicks rise. Run a festive push and order value spikes. None of that tells a brand whether it is building something durable on the shelf or simply renting a moment of visibility it cannot afford. The discipline is not collecting more numbers. It is knowing which few of them carry a signal.
What Counts as a Quick Commerce KPI
A useful key performance indicator predicts the health of the business; a vanity metric only describes activity. In-stock rate is the share of the time a product is actually available to buy at a given dark store. Share of voice is how often a brand appears in the results shoppers see for the searches that matter. TACoS, or total advertising cost of sales, is ad spend measured against total sales rather than ad-driven sales alone, which is why it exposes whether paid visibility is quietly eating the whole channel. These are the kinds of measures that move ahead of the outcome. This matters more now because the channel is large and fast: Bain & Company reports that quick commerce already handles more than two-thirds of India’s e-grocery orders and is growing at over forty per cent a year, so a brand measuring the wrong things is scaling its blind spots along with its sales.
01. Presence: The Number Under Every Other Number
The first number to watch is the least glamorous one: store-level in-stock rate. A product that is out of stock in a neighbourhood cannot be seen, cannot be bought, and quietly loses its ranking, because the system reads absence as weak demand. This is the measurement partner to everything covered in our piece on winning across Blinkit, Zepto and Instamart. The vanity twin here is the raw count of listings a brand has live. A large catalogue on the platform means very little if the products that matter keep falling out of stock in the stores that matter. Watch availability where demand actually sits, not the size of the range on paper.
02. Discovery: From Being Seen to Being Found
The second number is share of relevant search how often a brand shows up in the first results for the terms its shoppers actually type. Its vanity twin is impressions, which counts how many times an ad was served regardless of whether it led anywhere. Impressions are easy to buy and pleasant to report, and they rise whenever spend rises. Share of search is harder to move and far more honest, because being present for the searches that convert is what turns a browsing shopper into a buying one. A brand can win a great many impressions and still be invisible in the moments that matter.
03. Conversion: The Metric Closest to the Decision
The third number sits closest to the actual decision: view-to-purchase rate, the share of shoppers who buy after seeing the product. Its vanity twin is clicks. Clicks feel like progress, but on a shelf where the decision happens in seconds, a click that does not convert is often a sign that something downstream is wrong: a price that reads as off, an image that does not land, a pack that suits the wrong occasion. View-to-purchase strips the comfort out of the funnel and shows whether the listing is doing its job at the point of choice. It is the number that tells a brand the truth about its shelf.
04. Profitability: The Number the Festive High Hides
The fourth number is the one a festive spike is very good at hiding: contribution margin, read alongside TACoS. Gross order value can balloon during a sale while the margin underneath it bleeds, because the growth was bought with discounts and ad spend that never get counted in the celebration. Watching GMV alone is how a brand mistakes an expensive quarter for a successful one.
The brands that get this right treat efficiency, not raw scale, as the thing to defend. Working with Gits Food Products through Rakshabandhan: a short, brutal festive window with thin margins and newly launched products carrying little ad history, the work grew the range to roughly five times its usual run-rate on Zepto while return on ad spend rose 53% and cost per acquisition fell 25%, and the brand outgrew its category’s GMV by about 25%. The campaign later took a Silver at the e4M Performance Marketing Awards 2025. The lesson for a scorecard is that the growth only counted because the efficiency held. We shared the full story on LinkedIn.
05. Loyalty: Whether the Habit Is Forming
The fifth number asks whether any of this is compounding: repeat-purchase rate, the share of customers who come back to buy again. Its vanity twin is the count of one-time orders, which a discount can manufacture in a weekend, and which says nothing about whether a brand has become a habit. Quick commerce rewards familiarity: the brand a shopper reaches for without thinking, and repeat rate is the earliest honest sign that presence is turning into loyalty rather than just traffic. It connects directly to the behaviour we explore in the shift in retail media, where owning the moment of habit is worth more than winning a single sale.
The Quick Commerce Scorecard
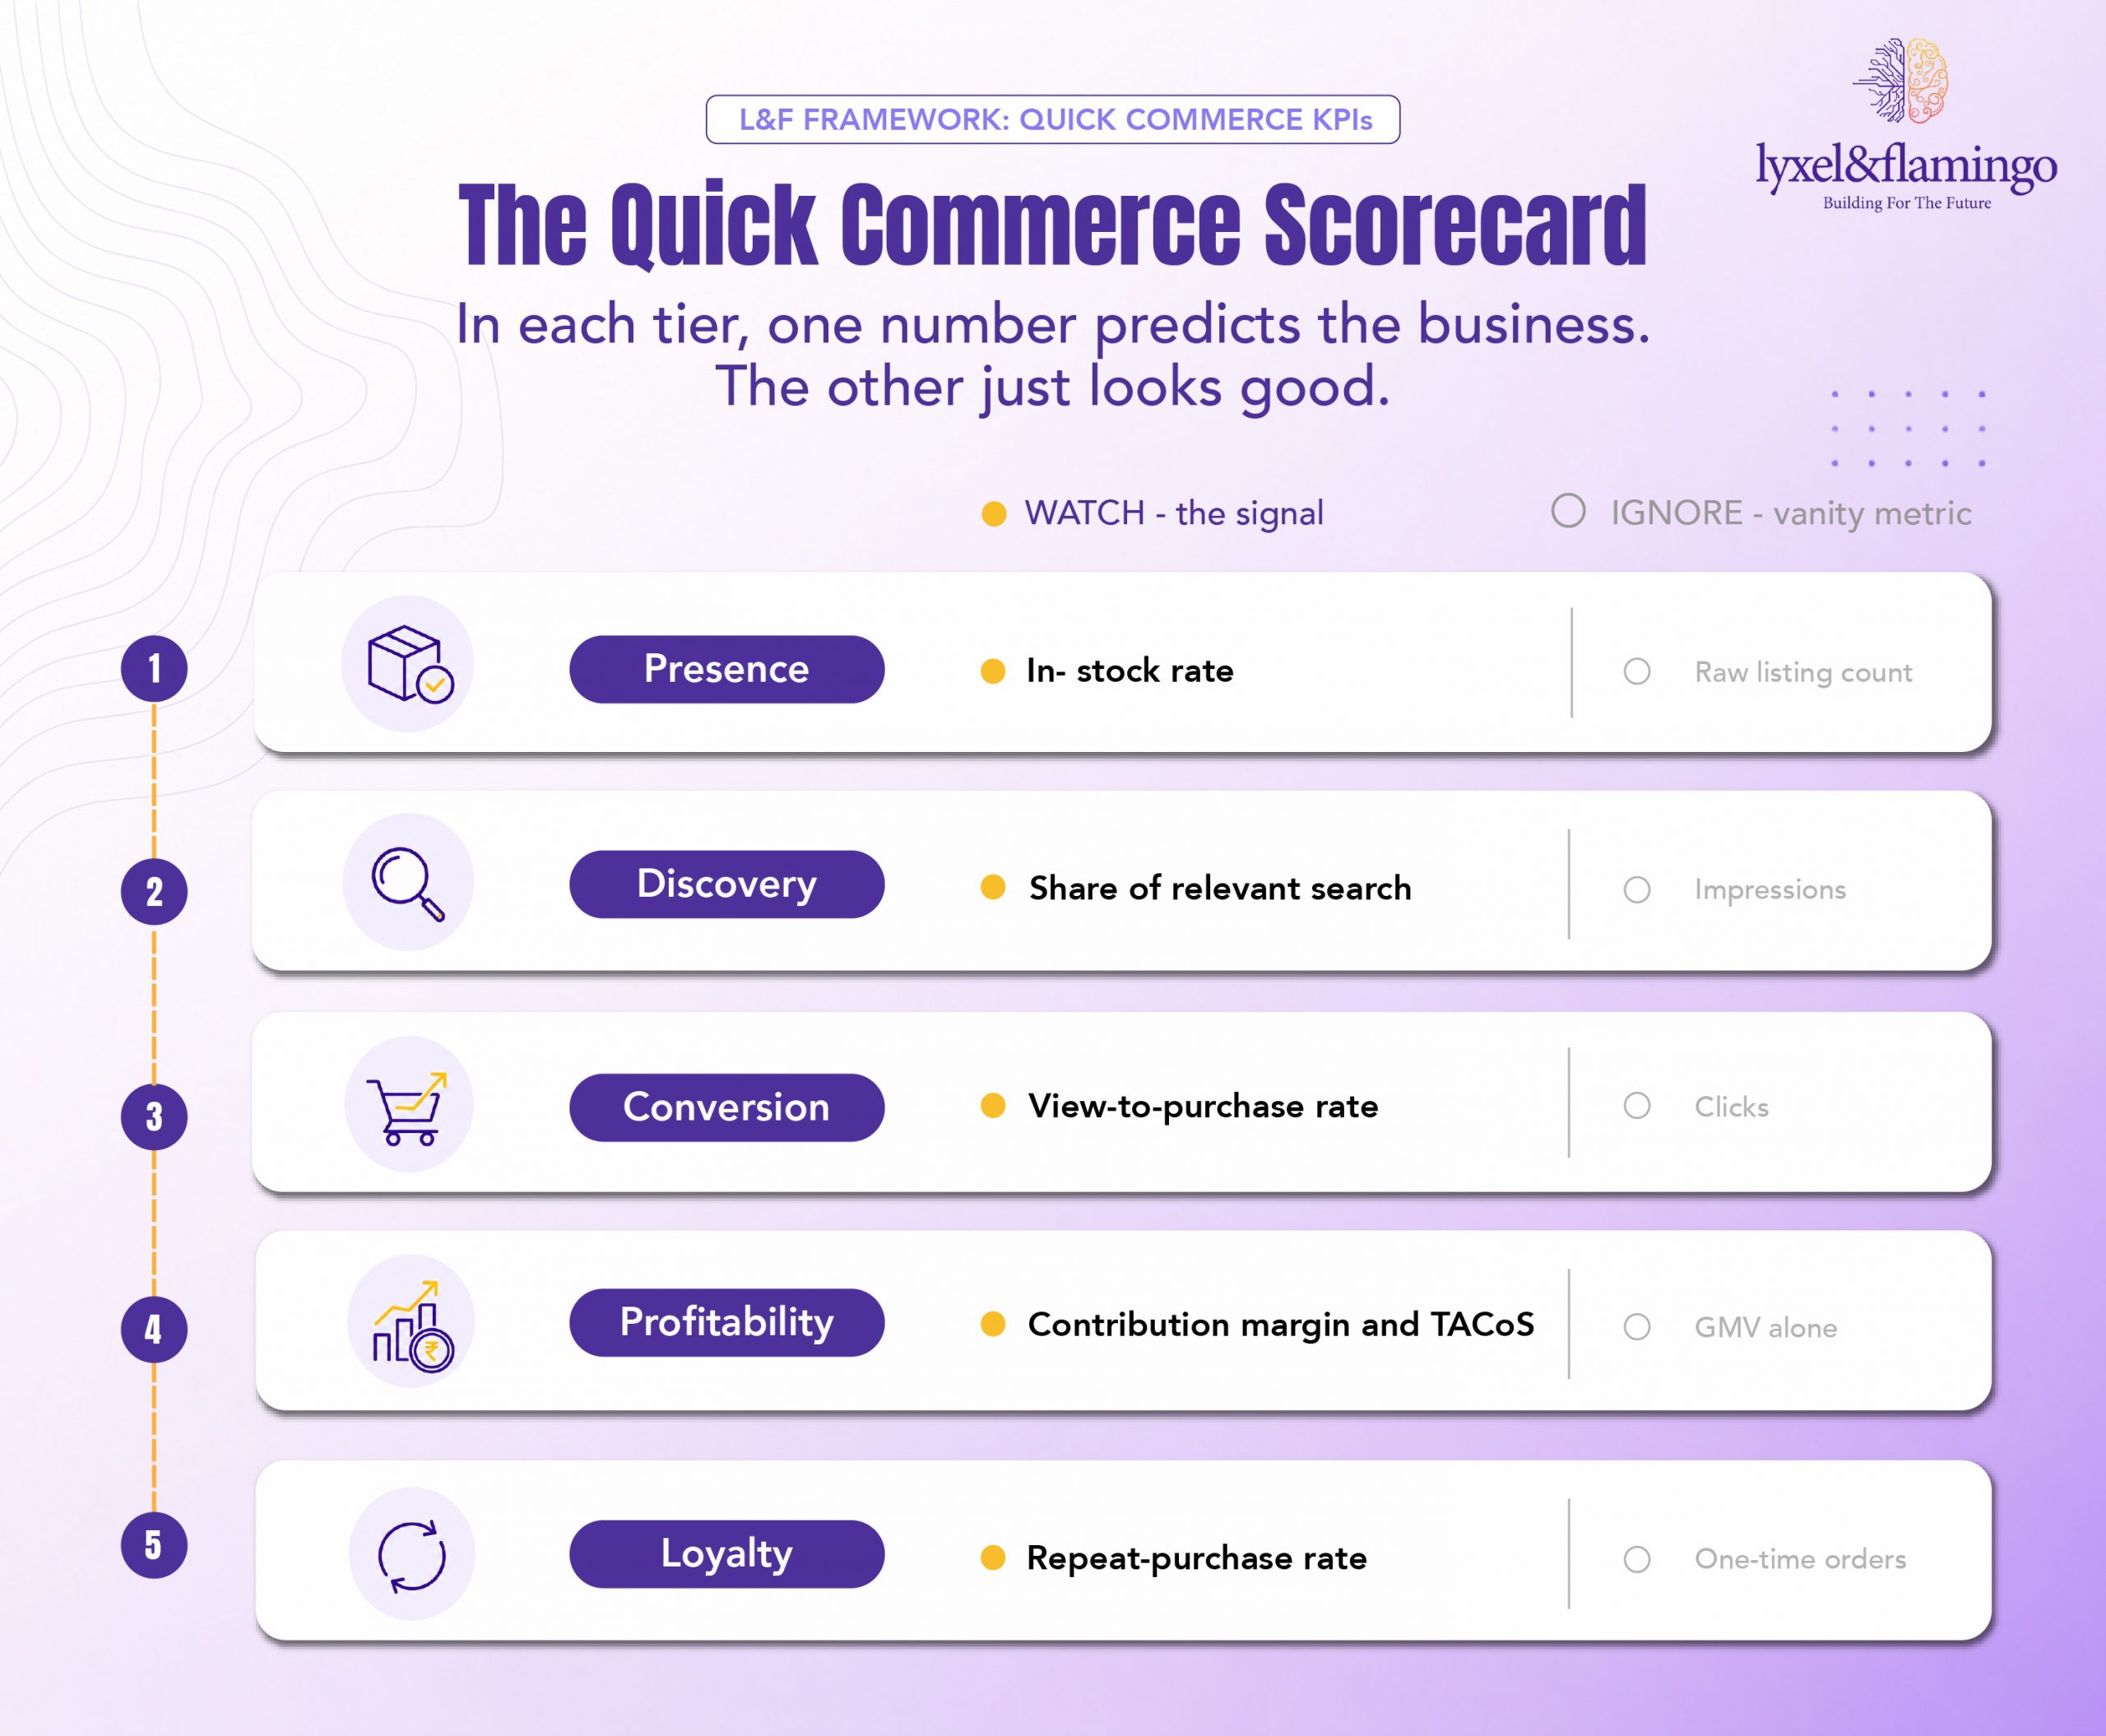
Held together, these five make a simple scorecard: one signal metric per tier, each paired against the vanity metric it is easily confused with. Presence is read through in-stock rate, not raw listing count. Discovery through share of relevant search, not impressions. Conversion through view-to-purchase, not clicks. Profitability through contribution margin and TACoS, not GMV alone. And Loyalty through repeat-purchase rate, not one-time orders. The tiers deliberately echo the Shelf Fit levers: availability, assortment, discovery, velocity, so a brand can see how the thing it builds on the shelf shows up in the thing it measures.
What the Winners Actually Watch
The uncomfortable truth underneath all of this is that the dashboards that impress a room are rarely the ones that inform a decision. It is easy to build a board slide where everything points up, and much harder to sit with the five numbers that tell you whether the channel is actually working. The brands that win on quick commerce are not the ones with the busiest dashboards. They are the ones that have decided, in advance, which handful of measures they will trust and which they will treat as noise, and then held their nerve when the noise looks more exciting than the signal.
So the question worth carrying into the next review is a quiet one. Of all the numbers on the screen, which five would still matter if the finance tab were open beside them, and are those the ones the room is actually watching?
Closing
Choosing the right scorecard is where quick commerce growth stops being a guess. It is work Lyxel&Flamingo does alongside brand teams: separating the numbers that predict the business from the ones that merely flatter it, and building the measurement that keeps a channel honest. If you would like a clear read on which metrics your brand should be watching on Blinkit, Zepto and Instamart, our marketplace team can walk your dashboard back to the five that matter. Start that conversation with us whenever you are ready.
Frequently Asked Questions
The measures that predict the business rather than describe activity: availability, search share, conversion, margin and repeat rate. The KPIs that matter on quick commerce are in-stock rate, share of relevant search, view-to-purchase rate, contribution margin with TACoS, and repeat-purchase rate.
On its own, no: it can rise on discounts and ad spend that erode profit. GMV is misleading without contribution margin and TACoS beside it, because a festive spike can grow order value while the channel loses money.
TACoS is total advertising cost of sales - ad spend measured against total sales, not just ad-driven sales. TACoS matters because it reveals whether paid visibility is quietly consuming the whole channel rather than adding to it.
Higher and more consistent at the dark-store level is what protects ranking; the exact target varies by category. Store-level in-stock rate is a leading indicator of ranking on quick commerce, because a product off the shelf cannot sell or rank.
By reading contribution margin against advertising and fulfilment costs, not by celebrating gross order value. Quick commerce profitability is measured through contribution margin and TACoS, which show whether growth was earned or bought.