
What this blog covers
Online shopping in India is no longer one predictable journey. The same shopper may use quick commerce for a fast top-up, then spend more time comparing products on a marketplace before a major purchase. This blog explores that split through the idea of “bipolar buying,” where the shopping mission shapes the channel, timing, product range and buying behaviour. It compares quick commerce and marketplaces across session length, basket size, visibility, demand patterns and the factors that influence conversion. It also introduces the Mission-Mode Model, which helps brands classify products as Refill, Rescue, Research or Event and build separate shelf, signal and performance strategies for each. With examples from Lyxel&Flamingo campaigns, the blog shows how brands can improve planning without treating every e-commerce shopper the same. It also covers five practical steps brands can use before their next campaign, from product tagging and scorecards to stock planning and creative testing.
Table of Contents
- What Is Online Shopping Consumer Behaviour?
- Why Your E-commerce Consumer Journey Map Is Lying to You
- What Splits the Consumer Buying Journey
- Online Shopping Consumer Behaviour in India, in Five Numbers
- The Mission-Mode Model: Five Moves for Two Shoppers
- Lyxel&Flamingo Proof: What Each Pole Looks Like When It Works
- 5 Things to Do Before Your Next Campaign
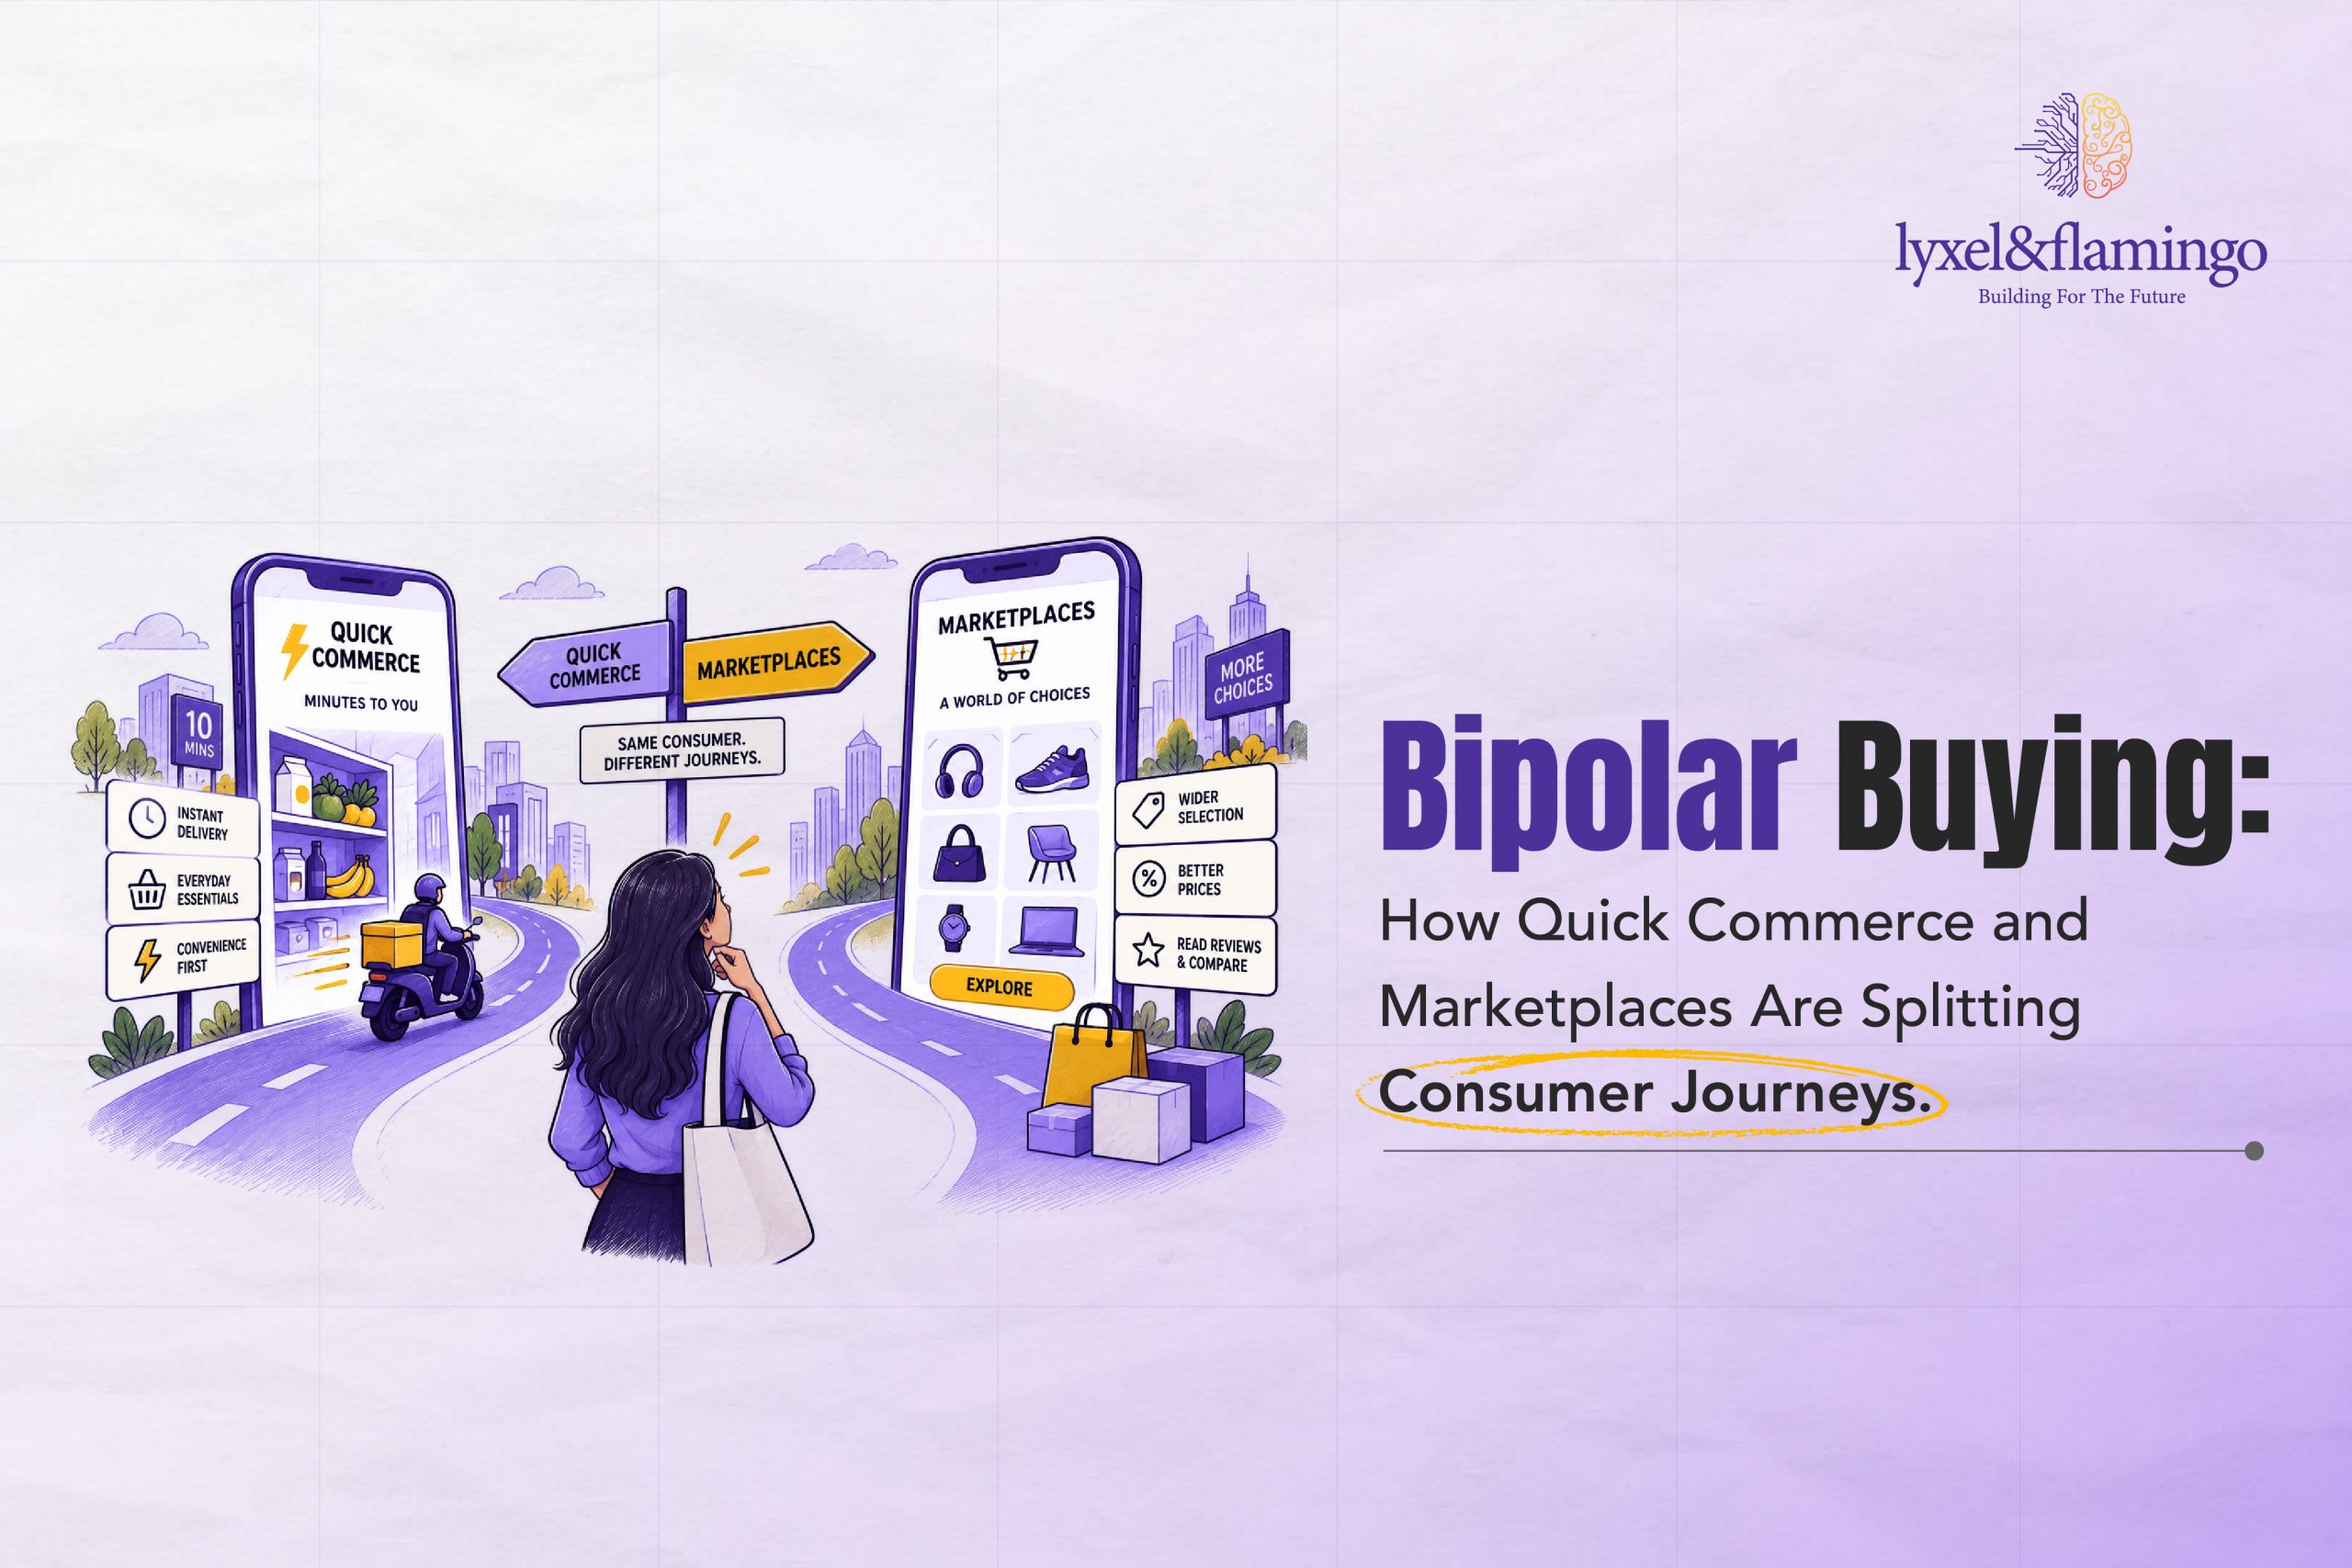
A quick commerce session in India lasts under five minutes and converts at eight times the rate of a traditional e-retail visit, according to Bain & Company’s How India Shops Online 2026. The same shopper then spends more than ten minutes hunting on a marketplace, and turns up at nearly triple the normal traffic when a festive sale opens. That is online shopping consumer behaviour in India today: one person, two opposite modes, and the mission decides which mode switches on.
Most brands still plan for a single “e-commerce” shopper. They write one brief, one creative set and one return target for two journeys that share almost nothing. That mismatch is not a media problem, it is a design problem, and it starts with how a shopper decides.
Speed is the entry ticket for household essentials, yet for other categories it acts as a trust marker. Bain describes that dual role in the same report, and it’s the reason a simple “fast versus slow” story breaks down the moment you try to plan a budget around it.
What Is Online Shopping Consumer Behaviour?
Online shopping consumer behaviour is the pattern of choices shoppers make as they discover, compare, choose and buy products on digital channels. It covers what triggers a purchase, how long the journey takes, which platform wins the order and what brings the shopper back.
In India, that pattern now runs on two tracks. Quick commerce delivers orders in under 30 minutes from small local warehouses, and it serves urgent or top-up needs. Marketplaces such as Amazon, Flipkart and Myntra list a wide range of products from many sellers, and they serve planned, compared and sale-timed buying. We call the pattern bipolar buying: one shopper, two opposite modes.
It matters now because both tracks are growing together. Bain puts India’s e-retail market at $65 to $66 billion in 2025, and quick commerce already carries 16% to 17% of that. This is why online consumer behaviour in India can no longer be read as one average.
Why Your E-commerce Consumer Journey Map Is Lying to You
Picture a brand plan with one line called “e-commerce”. One target, one creative set, one return figure, one owner. It looks tidy on a slide, which is exactly the trouble. It also hides two shoppers who behave in opposite ways.
The e-commerce consumer journey on a marketplace is a planned trip. Marketplace shoppers view more product pages per order, compare options and hold big purchases for a sale.
- NIQ’s 2026 India playbook puts the split neatly: habit loops in FMCG and beauty drive steady demand, while event triggers in mobiles and electronics drive the spikes.
- McKinsey’s February 2026 report gives the two poles separate jobs as well: marketplaces for scale and discovery, quick commerce for speed and convenience.
Quick commerce shopping behaviour runs on a different script. The shopper already knows the product, opens the app, searches, pays and leaves. There’s no comparing and no waiting around for reviews. Yet Bain expects that channel to reach $65 to $70 billion by 2030 and to supply 45% to 50% of India’s incremental e-retail growth, while traditional e-retail still holds more than 80% of the market today.
Google and Deloitte add a final wrinkle. Their April 2026 report says the linear funnel has given way to an always-on cycle of discovery, validation and instant gratification, and a journey map drawn as a straight line can’t hold that.
A brand that judges a five-minute top-up mission with a sale-window scorecard, or the reverse, will misread both.
What Splits the Consumer Buying Journey
Start with the side-by-side, because the gaps are easier to see than to describe.
Quick Commerce vs Marketplaces at a Glance
| Quick commerce | Marketplaces | |
| Typical mission | Predetermined and top-up needs | Comparison, planned and sale-timed buying |
| Session length | Under 5 minutes | Over 10 minutes |
| Visit-to-order conversion | About 8x the e-retail rate | Baseline |
| Basket | Small packs, lower order value | Wider range, higher order value |
| Where sales come from | Household essentials, 85% to 90% of sales value | Event-driven categories such as mobiles and electronics |
| Demand rhythm | Habit-led, any hour of the day | Sale windows, with nearly triple the usual daily traffic |
| What wins the order | Stock nearby, first-screen visibility, the right pack | Range, content, price signals and sale readiness |
Sources: Bain & Company (2026) and NIQ (2026).
Why does the split exist in the first place? Three structural reasons do most of the work, and none of them is about the shopper’s income or age.
- First, stock and geography decide everything. Quick commerce runs on small local warehouses, and Bain counts more than 7,000 of them across 200-plus cities, with two-thirds of the newest ones in top ten cities. A product only appears if it’s stocked nearby, so availability becomes part of the shelf itself. KPMG’s May 2026 note adds that quick commerce compresses discovery, evaluation and purchase into minutes and pushes buying toward smaller, more frequent, occasion-driven baskets.
- Second, the first screen is the whole pitch. Quick commerce shoppers view fewer product pages per order and lean on search, so first-screen visibility decides who wins. Marketplaces run the opposite economy: an endless aisle, reviews, feeds and video. Gen Z, at 40% to 45% of e-retail shoppers, discovers trends there through influencers and immersive content, according to Bain.
- Third, timing decides the rest. NIQ’s August 2026 research finds that 71% of shoppers globally start with a brand in mind, and that purchase decisions increasingly happen in the moment. Sale calendars still pull big purchases into windows, and brands plan around those dates. Everyday needs get solved the minute they appear, with no calendar involved at all.
The split follows the mission behind the order, not the person placing it. That is quick commerce consumer behaviour in one line, and it explains how the same shopper can grab milk in minutes and still wait for a sale before buying a phone.
One caution before you plan around two poles like they’re fixed rules. It’s a working simplification, not a law of nature. KPMG’s March 2026 report describes shoppers who discover a product online, validate it in a store and complete the purchase through quick commerce. BCG and DTDC size a four-to-six-hour rapid commerce lane at more than $20 billion by 2030. And IBEF’s e-commerce tracker records Flipkart targeting more than 1,500 dark stores by the end of 2026, up from 750 to 850 in early 2026, with Amazon India backing Amazon Now with US$300 million in April 2026. The middle is filling up, which is why the mission, not the platform, is the unit to plan around.
AI now adds a layer above both poles. Bain calls conversational commerce nascent in India, and a Gartner survey of 322 U.S. consumers in January 2026 found only 11% would let AI make a purchase decision in lower-stakes categories. Shoppers want help with research, and they still want the final say.
Want to see how a ten-minute shelf gets won or lost before the shopper even opens the app? Read this blog: How Brands Should List, Advertise, and Win on Instamart
Online Shopping Consumer Behaviour in India, in Five Numbers
Five findings carry most of the argument, and each one comes from a different source. Read together, they show quick commerce vs marketplaces as two real markets, not one market with two logos.
- Quick commerce sessions run under five minutes, compared with more than ten on traditional e-retail, with eight times the visit-to-order conversion. Shoppers arrive with a mission and leave when it’s done, so first-screen visibility matters more than page depth.
Festive periods bring about one in four new e-retail shoppers, with nearly triple the usual daily traffic. The traffic figure compares Flipkart’s Big Billion Days sale, September 22 to October 2, 2025, against July and August 2025, using Flipkart company data analysed by Bain. - Habit loops in FMCG and beauty drive steady demand, while event triggers in mobiles and electronics drive the spikes. NIQ still calls festive the single biggest value moment in Indian e-commerce, and describes growth as increasingly always-on.
- Google and YouTube appear in 93% of India journeys where consumers discovered a new brand, product or retailer. Discovery is shared across both poles, so the split happens at the point of purchase, not at the start.
- Quick commerce could reach $50 billion by 2030, with non-food categories taking 45% of its spend. Bain’s own forecast is higher, at $65 to $70 billion, so treat the exact figure as a range and the direction as settled.
The Mission-Mode Model: Five Moves for Two Shoppers
At Lyxel&Flamingo’s Third Party Marketplaces practice, we plan around missions instead of platforms. We call the approach the Mission-Mode Model, and it runs in five moves, in this order.
- Map the mission each product serves before anything else. Tag every product as Refill (habit), Rescue (urgent), Research (comparison) or Event (sale or gifting). One product can hold two missions in two cities, so this step comes first.
- Split the shelf so each mode gets its own packs, prices and range. Quick commerce needs small, price-clear packs and a few hero products kept in stock. Marketplaces need the full range, bundles and comparison-ready detail.
- Split the signal, because each mode persuades in a different way. A quick commerce thumbnail must show the pack and price in seconds. On marketplaces, videos, reviews and detailed pages do the persuading.
- Split the scorecard and stop blending returns. Track quick commerce on availability, first-screen share and in-session conversion. Track marketplaces on share of search, Buy Box and sale-window efficiency. And rerun quick commerce returns on selling price, since Zepto and Instamart dashboards report return on ad spend against MRP.
- Join both modes with one brand spine. Keep the same name, claim and price story everywhere, because 71% of shoppers start with a brand in mind and Google and YouTube sit in 93% of discovery journeys. KPMG’s 2026 blueprint says these channels should run as one engine, because consumers already experience them as one.
One note from experience worth repeating here. Our quick commerce funnel guide calls the reporting gap in move four arguably the single biggest source of wasted budget in the brand audits we run.
Running the same listing on every platform and wondering why one of them lags? Read this blog: Marketplace Growth Strategy: Scaling Across Amazon, Flipkart & Myntra
Lyxel&Flamingo Proof: What Each Pole Looks Like When It Works
Both poles have Lyxel&Flamingo results behind them, and every figure below comes from work we’ve already published.
The quick commerce pole looks like this. Gits Food Products had a short Rakshabandhan window, perishable stock, thin margins and new launches with no ad history. L&F focused on being findable in the exact windows the buying happened on Zepto, and adjusted as the festival moved. Our festive quick commerce guide reports these numbers:
- About 5x the usual run-rate for the new launches and the classic range together
- 53% higher return on ad spend across the festive window
- A 25% fall in cost per acquisition on the same campaign
- The brand outgrew its category’s sales value by about 25%
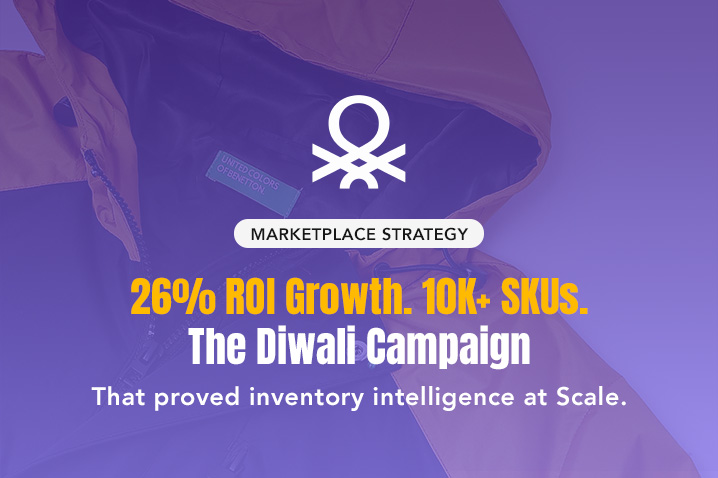
The marketplace pole runs on a different logic entirely. United Colours of Benetton came with more than 10,000 live products and a Diwali window where the platform pushed older stock at deeper discounts. L&F started from stock on hand instead of budget, split roughly one lakh units by cut size and past-month conversion, and gave each product tier its own placements and budget share. The case study L&F published on this campaign reports these numbers:
- About 26% growth in ad ROI on a similar investment base
- About 12% growth in click rate across the catalogue
- About 4% improvement in ad conversion rate, again at similar spend
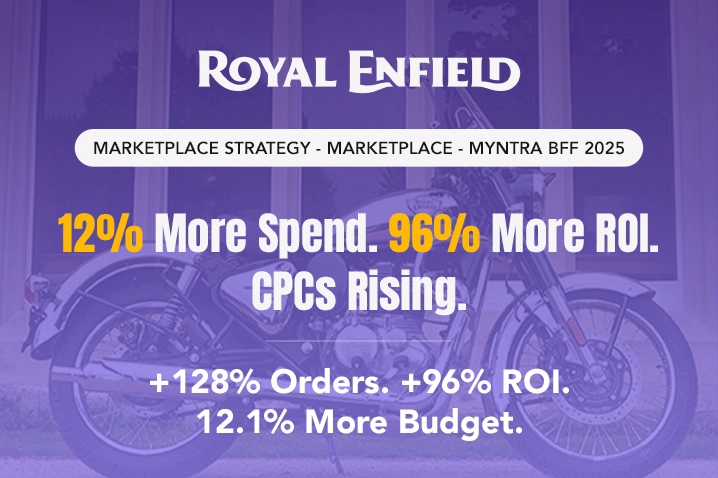
Royal Enfield’s Myntra Big Fashion Festival result shows the same discipline: orders grew, and 2x ROI on just 12.1% more spend.
Both results came from planning for the mission instead of chasing volume. These are single-brand outcomes and not benchmarks, so a different catalogue will move differently.
Planning a sale window before the banner goes live? Read this blog: The Flipkart Big Billion Days Playbook
5 Things to Do Before Your Next Campaign
- Label every product with one clear shopping mission this week. Use four tags: Refill, Rescue, Research and Event. Start with your top 50 products and tag them by city tier, since the mix of missions differs by city.
- Split your reporting into two scorecards before the next review. Quick commerce gets availability, first-screen share and in-session conversion. Marketplaces get share of search, Buy Box and sale-window efficiency, with no blended return target.
- Recalculate quick commerce returns on selling price, not MRP. Pull net order values from the platform reports and rerun last quarter. The gap can change which products you scale.
- Cut a small-pack range for quick commerce and test every thumbnail on a phone. Ask a colleague to read the pack and price in two seconds. If they can’t, redo the creative before any ad spend goes behind it.
- Lock sale-window budgets and stock before rivals list their deals. Cap top-of-search near 45% of budget for proven performers, as in the Royal Enfield case, and give the rest of the catalogue placements that suit how each product converts.
Conclusion
The split isn’t going away anytime soon, and planning around it pays off. Bain expects quick commerce to supply nearly half of India’s incremental e-retail growth through 2030, while traditional e-retail keeps 60% to 65% of the market. Brands that build for both missions now will hold an edge that gets structurally harder to copy once every rival has a ten-minute shelf of its own.
You don’t need to double your budget, you need two labels, two scorecards and one brand story that holds up on both. Track online consumer behaviour in India as two separate patterns from here on, not one blended chart. Do that before the festive season peaks and you’ll read your own numbers correctly for the first time.
If you’d like a second pair of eyes on your setup, talk to Lyxel&Flamingo’s Third Party Marketplaces team about auditing it for both modes. We’ll show you which products sit in which mission and where the money leaks.
Frequently Asked Questions
Quick commerce delivers in under 30 minutes for urgent or top-up needs, while marketplaces serve planned and compared buying.
No, traditional e-retail is expected to keep 60% to 65% of the market by 2030, while quick commerce grows to $65 to $70 billion and supplies 45% to 50% of new growth.
Household essentials make up 85% to 90% of quick commerce sales value today. Google and Deloitte expect non-food categories to reach 45% of quick commerce spend by 2030, while NIQ ties marketplace spikes to mobiles and electronics.
A quick commerce session runs under five minutes, and KPMG says discovery, evaluation and purchase now happen within minutes. Marketplace sessions run past ten minutes, and festive sales pull in nearly triple the usual daily traffic.
No fixed ratio that works for every catalogue. Start by tagging each product with its shopping mission, then set separate targets for each mode instead of one blended return figure.