
What this blog covers
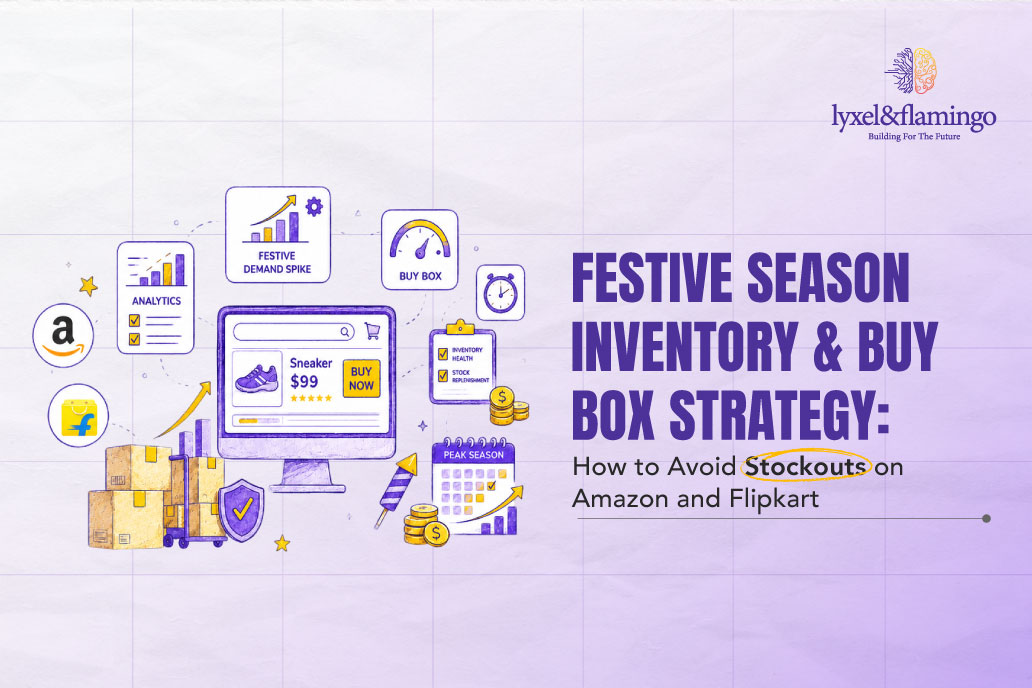
Festive sales can drive huge traffic, but strong demand can expose weak inventory planning very quickly. This blog explains why Buy Box performance on Amazon and seller visibility on Flipkart depend on more than competitive pricing. It shows how stockouts, slow replenishment, delivery performance, and seller metrics can affect marketplace visibility when demand spikes. The Festive Stock Ladder offers a practical approach built around baseline sales velocity, category-specific demand surges, replenishment speed, and cross-platform stock allocation. The blog also covers five actions sellers should take before the festive season, including early replenishment triggers, live stock tracking, performance audits, and supplier planning. For brands selling across Amazon, Flipkart, and quick commerce, the key lesson is simple: inventory planning needs to work alongside marketing, not after it. When stock availability and demand are planned together, sellers have a better chance of protecting Buy Box visibility and converting peak festive traffic during peaks.
Table of Contents
A seller can win the Buy Box on the morning of a festive sale and lose it by evening, not because a competitor undercut the price, but because the warehouse ran two days behind on replenishment. That’s the part most sellers get backwards.
Sellers lose the Buy Box far more often to empty shelves than to aggressive pricing, and most inventory teams still plan festive stock the way they planned it three years ago. That gap gets expensive fast. Across the third-party marketplace accounts we manage at Lyxel&Flamingo, the pattern repeats every festive quarter: a seller preps pricing, ad spend, and creative for weeks, then loses Buy Box win rate on day three of the sale because nobody modelled sell-through velocity against replenishment lead time.
Marketing teams treat the festive sale as a demand-generation problem. Ops teams treat it as a fulfilment problem. Neither owns the actual variable that decides whether a listing stays visible: the interaction between projected demand and available stock, updated hourly, not weekly. Amazon’s Great Indian Festival 2025 drew 276 crore customer visits, with 70% of that traffic coming from tier-2 and tier-3 cities, according to Amazon India’s newsroom. Flipkart’s Big Billion Days 2025 logged over 606 million visits in the first 48 hours alone. That’s not gradual demand. That’s a spike, and spikes break inventory models built on averages.
What Is Buy Box Strategy?
Buy Box strategy is the deliberate management of price, fulfilment method, and inventory availability so a seller’s offer wins the default “Add to Cart” placement on a product listing, rather than one of the alternate offers buried under “See All Buying Options.” On Amazon, this is officially called the Featured Offer, and it is calculated fresh, near-continuously, using landed price, delivery speed, and seller performance metrics together, not price alone. Flipkart runs an equivalent system through its F-Assured badge and seller-tier ranking, which weighs on-time dispatch and stock reliability just as heavily.
It matters most during festive sales because over 80% of Amazon purchases run through the Buy Box, and a stockout doesn’t just pause your sales. It resets your ranking signals, and rebuilding them after the festive window closes takes weeks you don’t get back.
Why Inventory Planning Breaks Before Pricing?
Take a seller who does everything right before the sale even starts. Creative is sharp, ad budgets are approved, the price ladder is mapped against three competitors. Then day two of the sale hits, sell-through triples against forecast, and the warehouse can’t replenish the top SKU fast enough. The listing goes out of stock for six hours. The Buy Box moves to a competitor mid-surge, right when conversion intent peaked.
It’s the default outcome of planning festive inventory the same way you’d plan a regular month, just scaled up by a flat multiplier. Redseer’s festive 2025 tracking showed Day 0 and Day 1 online retail GMV growing 23-25% year-on-year, a jump 4 to 5 times sharper than the equivalent two-day growth seen in festive 2024. A flat multiplier applied to last year’s baseline simply cannot absorb a curve that steep, and category-level surges make it worse. Amazon reported that premium smartphones priced above ₹30,000 grew 30% in 2025, with 65% of that growth coming from tier 2 and 3 cities, where fulfilment infrastructure is thinner to begin with.
A stockout during peak festive hours doesn’t just cost the sale you missed, it resets the ranking signals that took months to build.
Why Stock Depth Now Outweighs Discounting?
Amazon’s featured offer algorithm went through a meaningful shift with its May 2025 update, moving away from a model that leaned heavily on raw sales velocity toward a multi-factor approach that weighs customer satisfaction signals, delivery speed, and inventory reliability far more heavily than a year prior. Price still counts, but Amazon penalises offers priced more than 5% above the lowest listed price. But a seller who’s cheapest and out of stock loses the placement entirely, while a seller priced slightly higher with guaranteed same-day fulfilment and a 95%+ Valid Tracking Rate often wins it instead.
Think of it less like an auction and more like a credit score. Every dispatch, cancellation, and late delivery adds or subtracts from a rolling trust balance, and that balance decides who gets shown first when ten sellers list the same product. Flipkart runs a parallel logic through its seller-tier system: sellers who hold zero cancellations and are consistent on-time dispatch typically reach Silver tier within 30 days and Gold within 60 to 90, and that tier directly shapes search placement, not just the F-Assured badge alone.
Here’s how the two systems actually compare on what they reward:
| Factor | Amazon Featured Offer | Flipkart F-Assured / Seller Tier |
| Price threshold | Penalises listings 5%+ above lowest offer | Competitive pricing weighed, not sole factor |
| Fulfilment speed | FBA/SFP prioritised; 0-day handling required for premium shipping (Oct 2025 update) | On-time dispatch is the primary tier driver |
| Stock reliability | Inventory depth and stockout history tracked | Stock-outs directly suppress tier and badge status |
| Seller performance | Valid Tracking Rate (95% min), cancellations, returns | Cancellation rate, return rate, dispatch consistency |
| Ranking cadence | Recalculated near-continuously | Recalculated on rolling performance windows |
At Lyxel&Flamingo, we’ve stopped advising festive clients to lead with discount depth as the primary lever. The sellers who protect Buy Box win rate through a festive sale are the ones who treat stock availability as a ranking metric, on par with price, not a warehouse concern that sits outside the marketing conversation.
Want to see how these ranking signals differ once you add a third platform like Myntra into the mix? Read this blog: Marketplace Growth Strategy: Scaling Across Amazon, Flipkart & Myntra
The Evidence: What the Data Actually Shows
India’s e-commerce GMV crossed ₹1,15,000 crore (roughly US$13.12 billion) in festive season 2025, growing 20-25% over the prior year. This is what “peak demand” now means in absolute terms, and it means the inventory buffer that covered a normal month falls short by a wide margin during the festive window.
Nearly 45% of festive shopping in 2025 shifted to quick commerce platforms, a channel where inventory windows are measured in hours, not days, and where Blinkit ran select deliveries under three minutes during the season. Brands planning festive stock purely for marketplace fulfilment are now missing a channel that commands close to half of seasonal demand.
India’s online retail GMV closed 2025 at approximately $65-66 billion, growing 19-21% in value terms, with daily active users touching roughly 120 million during peak festive events, according to Bain & Company’s How India Shops Online 2025 report, produced in partnership with Flipkart. A demand base that size, concentrated into a handful of peak days, is precisely why static reorder points fail.
AI-driven demand forecasting improves forecast accuracy by up to 50% and cuts stockouts by as much as 65% in consumer goods categories, per McKinsey & Company’s research on AI in distribution and supply chain operations. For sellers still running festive planning off a spreadsheet and a gut-check multiplier, this is the single largest available accuracy gain.
Stockouts remain one of the most expensive silent failures in retail, with unavailable products driving a large share of shoppers straight to a competitor listing within the same session. Deloitte’s broader consumer research across 2025 found discretionary and festive-period spending rising steadily even as inflation concerns eased, which means demand intent during the festive window is real and growing, not a short-term blip sellers can under-plan for.
The Lyxel&Flamingo Festive Stock Ladder
At Lyxel&Flamingo’s Commerce Strategy practice, we use a four-tier model to sequence festive season inventory planning against actual demand curves rather than flat forecasts. We call it the Festive Stock Ladder.
- Baseline Velocity Layer: Pull 90 days of pre-festive sell-through data per SKU, segmented by city tier. This becomes your floor, not your forecast. Most teams stop here, which is exactly the mistake.
- Surge Multiplier Layer: Apply category-specific surge ratios, not a flat “2x everything” rule. Electronics and mobiles surged far harder in 2025 than staples did; a single multiplier flattens that difference and under-stocks your fastest-moving SKUs while over-stocking the slow ones.
- Replenishment Speed Layer: Map how fast you can restock each SKU mid-sale against how fast it’s actually selling. This is the layer we see under-invested most consistently across the brands we work with, and it’s the one with the most immediate impact on Buy Box win rate, because a two-day replenishment lag against a 48-hour demand spike guarantees a stockout window regardless of how accurate your forecast was.
- Cross-Platform Allocation Layer: Split stock across Amazon, Flipkart, and quick commerce based on where each SKU’s demand actually concentrates, not an even three-way split. A product that over-indexes on quick commerce needs a different buffer logic than one that sells primarily through Amazon FBA.
The third layer, replenishment speed, is where most festive stockouts originate, not the forecasting layer everyone obsesses over. Get the first two layers right and still ignore this one, and you’ll watch the Buy Box slip anyway, mid-sale, right when it costs the most.
Splitting stock across Amazon, Flipkart, and a third marketplace comes with its own sequencing problem. Read this blog: Marketplace Growth Strategy: Scaling Across Amazon, Flipkart & Myntra
What This Looked Like for One Category Seller
A consumer durables seller came to L&F ahead of festive 2025 having lost the Buy Box on their top three SKUs during the prior year’s sale window, each time within the first 36 hours of peak traffic. The brief wasn’t pricing. It was that inventory and marketing were planned in separate documents that never talked to each other.
We rebuilt their festive planning around the Stock Ladder, mapping replenishment lead time against projected hourly sell-through for each SKU rather than a single daily average, and reallocated safety stock away from slow movers toward the three SKUs carrying the ad spend.
- No stockout hours on the top three SKUs across the full festive window, against a meaningful chunk of combined hours lost the previous year
- Buy Box win rate held consistently high through peak days, a sharp turnaround from the mid-sale drop the brand saw in 2024
- A double-digit lift in festive revenue on the same ad budget, driven almost entirely by sustained placement rather than new spend
5 Things to Do Before Your Next Festive Sale
- Segment your surge multiplier by category, not by account. Don’t apply one blanket “expect 3x demand” rule across your whole catalogue. Pull last festive season’s category-level growth (electronics moved very differently from home and kitchen in 2025) and build separate multipliers. This single change catches most of the under-stocking errors before they happen.
- Set a replenishment trigger at 60% stock depletion, not 20%. Waiting until you’re nearly out before reordering only works if lead time is near-zero. During festive weeks, it isn’t. Trigger replenishment early enough that the restock lands before the shelf actually empties.
- Audit your Valid Tracking Rate and cancellation rate a full month before the sale starts. Both feed directly into Buy Box eligibility on Amazon and tier status on Flipkart. Fixing them mid-sale is too late. These metrics need a clean 30-day track record heading into peak week.
- Build a live stock dashboard that ops and marketing both check, not two separate spreadsheets. The single biggest cause of festive stockouts isn’t bad forecasting. It’s marketing running ad spend against a stock level that ops already knows is critical, because nobody’s looking at the same number.
- Pre-negotiate expedited replenishment with your top three suppliers before the season starts. Even a strong forecast will occasionally miss. What decides whether that miss costs you the Buy Box is how fast you can restock once it’s clear the forecast was wrong, and that speed gets negotiated in July, not October.
Conclusion
Buy Box strategy during the festive season isn’t a pricing exercise with inventory attached to it. The sellers who protect their placement through peak days are the ones who stopped treating stock depth as an ops-only metric and started planning it alongside every other ranking input, months before the sale opens, not during it.
The gap between a seller who plans festive stock against real hourly sell-through and one who’s still using last year’s flat multiplier is going to widen, not close, as quick commerce and tier 2/3 demand keep pulling festive GMV further from predictable patterns.
If your festive inventory plan currently lives in a different document than your Buy Box strategy, that’s the fix to make first. Speak to Lyxel&Flamingo’s Commerce Strategy team about a festive readiness audit before your next sale window opens.
Frequently Asked Questions
It's how sellers manage price, fulfilment speed, and stock availability together so their offer wins the default purchase placement on a listing. Price alone doesn't decide it; Amazon's algorithm weighs delivery speed and seller performance metrics just as heavily, especially since the May 2025 update.
Build category-specific surge multipliers instead of one flat forecast, set replenishment triggers well before stock actually runs low, and keep a live dashboard that both ops and marketing check. Most stockouts happen because replenishment speed wasn't mapped against real sell-through velocity, not because demand was unpredictable.
Amazon's Featured Offer is recalculated near-continuously using landed price, fulfilment method, and performance metrics. Flipkart's F-Assured badge and seller-tier system work on rolling performance windows, weighing on-time dispatch and cancellation rates heavily. Both punish stockouts, but through slightly different mechanics and timeframes.
Yes, and often more so than for large sellers, because mid-sized accounts have thinner margins for absorbing a lost Buy Box window. A stockout during peak festive hours costs disproportionately more than the same stockout on a regular Tuesday, since ranking signals reset right when traffic and conversion intent are highest.
At least 8 to 10 weeks before the sale begins, since supplier lead times and replenishment negotiations need to be locked before the surge hits, not during it. Waiting until the month before the sale leaves no room to fix supplier-side bottlenecks if the forecast reveals a gap.