Table of Contents
- What Is Incrementality in Marketing?
- The Real Problem With Enterprise Marketing Measurement
- How Geo Experiments Actually Work
- Why Incrementality Testing Is Now Non-Negotiable
- The L&F Geo Experiment Architecture for Enterprise Brands
- What This Looks Like in Practice
- Four Things to Do Before Your Next Campaign Launch
- Conclusion
Here’s what it covers
As digital advertising budgets continue growing across India, many enterprise brands are finding that traditional measurement approaches do not always provide a complete picture of marketing effectiveness. Attribution models and platform-reported metrics can highlight where conversions happened, but they often struggle to explain whether marketing activity genuinely influenced those outcomes in the first place.
This blog explores incrementality testing through geo experiments, a measurement approach that helps brands understand the true business impact of their media investments. By comparing matched treatment and control markets, organisations can measure the additional sales, conversions, or customer acquisitions generated by a campaign beyond what would have occurred naturally. The result is a clearer view of marketing contribution that extends beyond dashboard reporting.
The blog also examines why incrementality testing is becoming increasingly important as advertising spend rises, while outlining common mistakes that reduce experiment accuracy. Topics include market matching, holdout design, statistical planning, test duration, and the practical challenges enterprise teams encounter when translating measurement into budget decisions.
Lyxel&Flamingo’s media operations experience introduces the Geo Lift Precision Stack, a structured framework designed to help enterprise brands build reliable geo experiments and connect findings directly to media planning. The discussion is supported by a real-world D2C case study, showing how better measurement can lead to more confident budget allocation and stronger long-term marketing performance.
Many marketing teams keep spending more based on reports that don’t show the full picture. Platform data can be misleading. Customer actions often tell a different story altogether.
Did marketing truly drive that sale, or was the customer already planning to convert anyway?
This points to the incrementality problem, a challenge that often has a bigger impact on marketing budgets than many teams initially expect.
India’s digital advertising market crossed the Rs. 1,00,000 crore mark in FY25, with digital now accounting for nearly 46% of total ad spend, per Crisil Intelligence. India’s digital ad market is also projected to nearly double to US$ 22 billion by 2030, according to IBEF. At that kind of scale, getting measurement wrong is not a reporting inconvenience. It is a strategic failure that costs enterprise brands crores in misdirected budgets every single quarter.
Geo experiments can reveal effects that attribution reports often miss. When done properly, they offer a clearer view of what is driving results. In this blog, we break down how to run them at scale, where enterprise teams commonly slip up, and how the L&F framework helps shape better budget decisions.
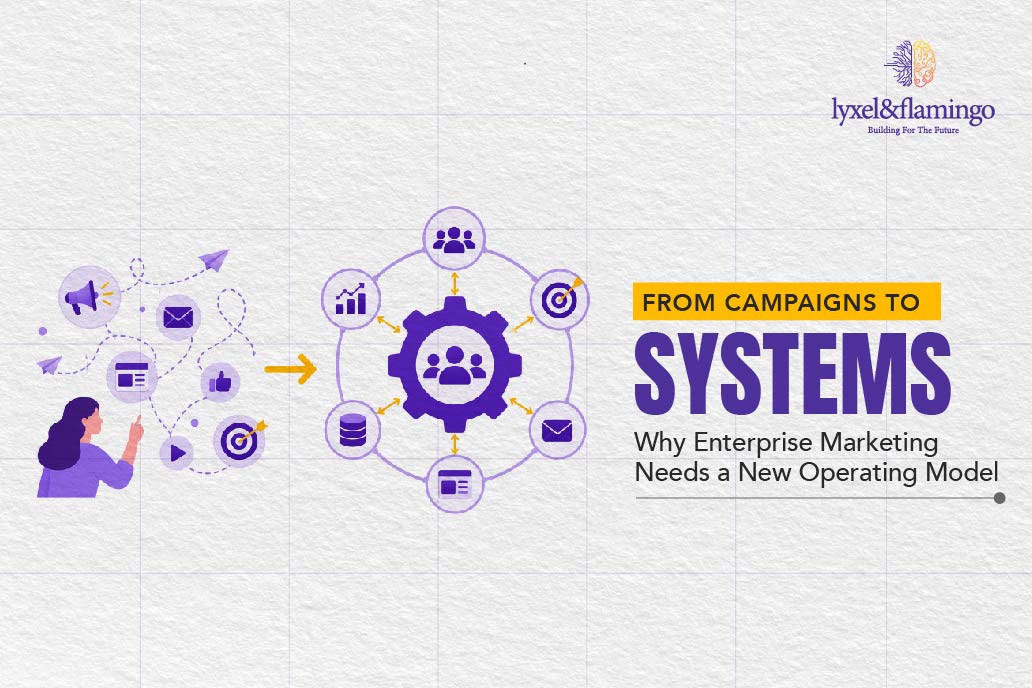
What Is Incrementality in Marketing?
Incrementality is the measurable business uplift, whether that’s sales, sign-ups, store visits, or app installs, that you can directly trace back to a specific marketing action, after you account for what would have happened without it. It is the difference between a conversion your campaign caused and one that was heading your way, regardless of how much you spent.
In practice, an incrementality test compares two groups. One group gets exposed to your campaign (the treatment group). The other does not (the control or holdout group). The gap between their conversion rates is your incremental lift. No messy overlapping customer journeys, no shared channel attribution windows pulling revenue attribution in six different directions. Just a clean, casual measurement that holds up in a finance meeting.
This matters right now because the performance marketing analytics tools most teams rely on were built for a world that no longer really exists. Without incrementality testing, most enterprise marketing teams are actively optimising toward metrics that measure the measurement, not the actual business impact.
The Real Problem With Enterprise Marketing Measurement
Every quarter, brands increase paid search budgets after platform dashboards report stronger ROAS numbers. Leadership approves higher spending without much resistance. Few teams pause long enough to question whether those customers were already searching, comparing, and planning purchases before the campaign even started.
McKinsey’s CMO survey data found that only 41% of marketing leaders consider their organisations mature in performance measurement. The McKinsey State of Marketing Europe 2026 Report points in the same direction:
- Measurement,
- Budgets, and
- AI
They need to work as one system, not three separate conversations, for growth to be defensible going forward.
One finding deserves closer attention from marketing leaders and CMOs alike. Traditional measurement methods overstated conversion impact by nearly 6x, which made several campaigns appear much stronger than they really were.
Platform attribution tells you where the credit went. Incrementality testing tells you whether any of that credit was real.
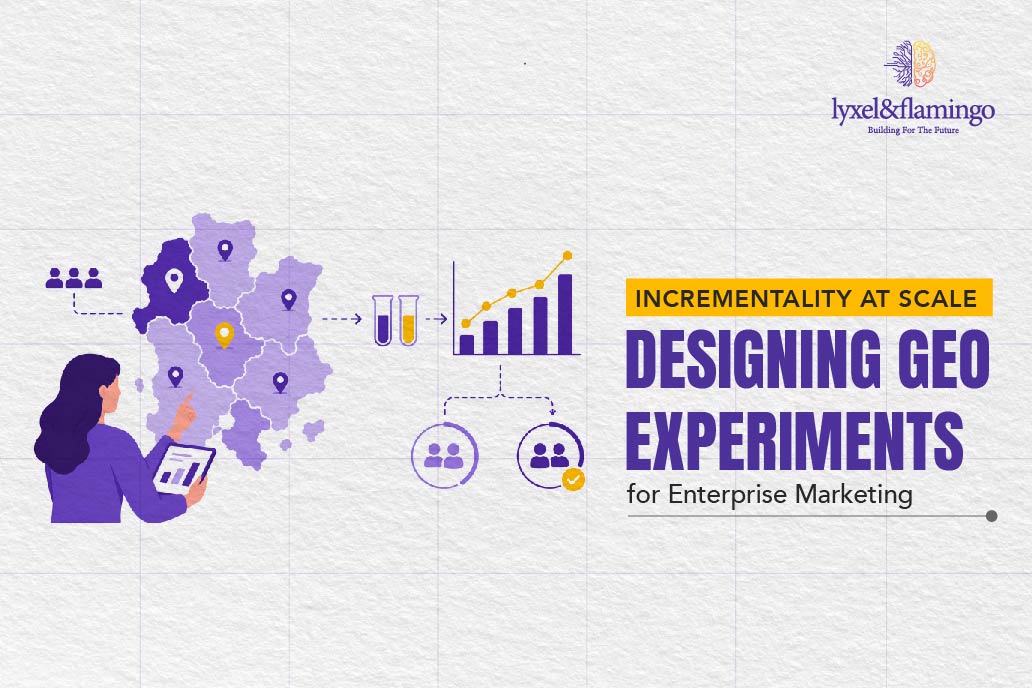
How Geo Experiments Actually Work
Geo experiments, sometimes called geo holdout tests or geo-targeted campaign measurement studies, are the most widely used method for establishing channel incrementality at scale. You divide your media market into geographic regions, run your campaign in some of them (treatment regions) while keeping things business-as-usual in the others (control regions), then measure what the outcomes looked like across both sides.
This method does not rely on cookies. It does not need cross-device tracking. And it is not subject to platform reporting bias. The geography becomes the randomisation unit, which means the experiment captures total business impact, including offline effects, and not just what a tracking pixel happens to see.
Three core design models matter in practice:
- The Geo Holdout (Blackout Test): You run your campaign in most markets but deliberately withhold it from a matched set of regions. If those holdout regions underperform the exposed markets, that gap is your incremental lift. This is especially useful for channels that do not allow granular audience-level targeting, such as out-of-home, linear TV, and certain programmatic placements.
- The Geo Uplift (Treatment-First) Test: You increase spend or introduce a new channel exclusively in selected test regions while keeping control regions at baseline. The performance of treatment regions above that baseline is your incremental effect. This works well for testing new channels, such as CTV, audio, or regional print, before committing to a national rollout budget.
- The Synthetic Control Model: When perfect geographic matches simply are not available, a synthetic control builds a statistical twin for the exposed geography. It does this by weighting a pool of 10 to 20 control regions to mirror the treatment market’s historical behaviour. This is standard econometric practice in marketing measurement and is increasingly common in marketing measurement at scale platforms used by enterprise teams who operate across fragmented geographies.
Each model answers a different business question. The Geo Holdout tells you what you would lose by stopping. The Geo Uplift tells you what you would gain by starting. The Synthetic Control handles scenarios where clean market separation is not realistic, which is a very common situation across India’s overlapping metro catchment areas.
When combined with Media Operations frameworks, especially for non-biddable media like TV, OOH, and print, where auction-based attribution does not exist at all, geo-experiment marketing is often the only valid measurement option available to a brand.
Why Incrementality Testing Is Now Non-Negotiable
- More than 52% of US brand and agency marketers are already running incrementality testing and experiments. The gap continues to get wider across many industries. Brands that have not started testing yet often compare performance against benchmarks that more advanced competitors stopped relying on quite some time ago.
- Brands that run continuous experimentation see 30 to 45% better ad performance compared to those that do not. And yet fewer than 25% of advertisers run controlled tests regularly. That gap is where the budget is being wasted.
- In India specifically, the context makes this even more pressing. India added 56 million new internet users in 2025, taking the total base to 806 million at 55.3% penetration. India’s digital market is also projected to touch US$ 550 billion by 2035. The brands building measurement rigour now are compounding an advantage that will be genuinely difficult to close in a few years.
The L&F Geo Experiment Architecture for Enterprise Brands
At L&F’s Media Operations practice, we use a four-layer model to design geo-based incrementality testing programmes that hold up under finance and C-suite scrutiny. We call it the Geo Lift Precision Stack.
Most enterprise teams run one or two geo tests per year as a validation exercise, something to point at in a quarterly review. The Geo Lift Precision Stack treats experimentation as a continuous operating rhythm, not an annual audit.
Layer 1: Market Stratification and Matching
Before any experiment is designed, markets need to be properly classified. Not just by size or revenue, but by structural similarity across four dimensions: historical sales variance, media saturation levels, consumer behaviour patterns, and campaign-eligible reach. In India, this step is particularly important. A Tier-1 metro and a Tier-2 market might carry similar aggregate revenue but have completely different consumer journey structures underneath. If you treat them as comparable control pairs without checking, you produce noise instead of a signal.
We run pre-test correlation analysis across at least 12 weeks of historical data before matching treatment and control regions to each other. The matching coefficient should exceed 0.8 before any experiment goes live. Markets that fall below this threshold get excluded or moved into synthetic control pools, where they are more useful.
Layer 2: Channel-Specific Holdout Design
Different channels need different holdout structures, and this is where a lot of enterprise programmes cut corners. Paid search holdouts work at the keyword or geo level inside Google Ads’ native experiment framework. Social media holdouts can be managed through Meta’s Conversion Lift tool or through audience-level suppression. Non-biddable media, TV, OOH, and radio, require the geographic blackout approach, where media buys are deliberately absent in holdout regions throughout the test window.
For enterprise brands running four or more channels simultaneously, we design staggered holdout windows to avoid interference effects between experiments. Running a TV blackout and a paid search holdout in the same region at the same time creates more channel attribution noise than it solves, and revenue attribution across those overlapping windows becomes essentially meaningless. The experiments need to be sequenced deliberately, not just launched together.
Layer 3: Statistical Power and Duration Planning
This is where most enterprise geo experiments fail. Sample size is not about reach. It is about detecting a meaningful signal above baseline variance. For high-volume categories with daily sales data, three to four weeks can be sufficient. For lower-frequency purchase categories or channels with delayed attribution windows, six to eight weeks is closer to the minimum you should accept.
For example, one retail chain measured a 19% lift during a two-week CTV geo study and celebrated the result. Later, an eight-week test showed the real lift was closer to 6%. Short measurement windows often create misleading conclusions. The result looks impressive in reports. The underlying reality may be very different.
Layer 4: iROAS Translation and Budget Reallocation
An incrementality test that does not connect to an actual budget decision is a research exercise dressed up as a measurement programme. The final layer of the Geo Lift Precision Stack is a standardised output format that translates incremental lift into iROAS and maps that figure against cost-per-incremental-acquisition thresholds set in advance with the finance team. Not after the results are in.
One important recalibration that needs to happen early: incremental ROAS figures will run lower than traditional platform ROAS, because incrementality holds advertising to a much higher measurement bar. Marketers used to last-touch numbers need to reset expectations before sharing results upward, or the measurement programme takes the credibility hit instead of the attribution model that deserves it.
Across our work with D2C brands, the fourth layer, turning the iROAS into the next media plan, is consistently the most under-invested piece. Getting the number is half the job. Operationalising it into actual budget reallocation is the half that creates commercial value.
What This Looks Like in Practice
For a D2C personal care brand operating across 12 Indian cities, L&F’s Media Operations team designed a six-week geo holdout experiment to test whether their performance marketing investment in paid social was genuinely driving first-time purchasers, or whether it was mainly reaching people already inside the purchase funnel.
The setup: we matched six city pairs on historical conversion rates, seasonal patterns, and channel-level media density. Three cities received the fully paid social programme. Three cities were held out from paid social entirely, with only owned channels running, email and push notifications.
The experiment revealed a 22% lift in new customer acquisition across treatment cities. Repeat purchases showed no measurable change at all. That finding challenged existing assumptions. The team shifted 30% of paid social spend toward prospecting geo-targeting campaigns, while retention budgets moved into email and loyalty channels where purchase intent signals were already much stronger.
The incremental measurement is connected directly to L&F’s broader approach to performance marketing without waste, where cleaner data and honest measurement translate into better ROAS, not just dashboards that are easier to present.
Four Things to Do Before Your Next Campaign Launch
-
Audit Which Channels Have Never Been Incrementally Tested
Go through your media plan and mark every channel as either tested or untested. Paid search, social, programmatic display, CTV, OOH, radio, all of them. Most enterprise brands will find two or three channels with meaningful budgets that have never been through a controlled experiment. Start with those. The channels most likely to fail an incrementality test are the ones that have been running the longest without anyone questioning them.
-
Define Your Minimum Detectable Effect Before Designing the Test
Before you assign markets or set test durations, decide what incremental lift would actually change a budget decision. If a 3% lift would not move spend, do not design a test sensitive enough to detect 3%. You need statistical power calibrated to actionable thresholds, not theoretical precision. For most enterprise brands, a 10 to 15% incremental lift is the minimum signal worth designing around. Build the experiment to detect that, not something smaller that nobody will act on anyway.
-
Set Your Control Group at 10 to 15% of Total Reach
A common mistake is keeping holdout groups too small to preserve reach. A control group below 10% of total reach is unlikely to generate statistically significant results for most campaign sizes. The standard starting point of 10% control, 90% exposed, gives you enough holdout data while limiting revenue sacrifice during the test window.
- Brief Finance Stakeholders on iROAS Before the Results Come Out
The single biggest reason geo experiments fail to influence budget decisions is not bad data. It is unprepared for stakeholders. iROAS benchmarks are typically lower than platform ROAS, and if a finance team sees a 1.8 iROAS after being told the channel delivers 4.5x ROAS on the dashboard, the experiment’s credibility takes the hit instead of the attribution model. Brief stakeholders before results are shared. The expectation needs to be set: incremental measurement is a higher standard, not a worse result.
Conclusion
The enterprise brands that compound measurement advantage over the next two to three years will not be the ones with the most sophisticated attribution stacks. They will be the ones who know which channels are actually driving growth, because they ran the experiments to find out.
Geo experiments are not a research exercise. At scale, they are a budget allocation engine. Every experiment that correctly identifies a zero-lift channel frees capital for something that works. Every experiment that confirms genuine incrementality gives the media team real evidence to defend and scale that investment.
India’s advertising market is growing fast, projected to reach US$ 16 billion in 2025 according to Magna Global via IBEF, and the brands capturing sustainable growth from that scale are the ones treating measurement as a practice, not a post-campaign report.
At L&F’s Media Operations practice, we build geo-based incrementality testing programmes for enterprise brands that connect experiment outputs directly into the next media plan. Not just the numbers. The decisions that follow them.
Want to know which channels in your current plan are actually earning their budget? Speak to L&F’s Media Operations team for a measurement readiness assessment.
Related reading:
- Non-Biddable Media Explained: Unlocking Incremental Reach Beyond Auction-Based Buying
- Performance Marketing Without Waste: Smarter Targeting, Cleaner Data, Better ROAS
Frequently Asked Questions
Incrementality measures the business impact that advertising genuinely creates. It helps teams understand whether a campaign drove new sales, conversions, or customers. The focus stays on cause and effect. Many reporting methods show relationships between activity and outcomes, but they do not always prove what truly influenced the result.
Geo experiments compare similar regions by exposing one group to a campaign while keeping another unchanged. Teams then measure differences in sales, revenue, or conversions. That gap reveals incremental impact. The approach works across channels, respects privacy requirements, and avoids dependence on individual user tracking methods.
Geo experiment marketing sizing depends on conversion rates, expected impact, and market performance variation. Many teams begin with a strong treatment and control split. Timing matters too. Tests shorter than four weeks often create distorted findings. Longer purchase cycles usually need six weeks or more for dependable results.
Attribution shows which channels appeared along the customer journey before conversion happened. Incrementality testing looks deeper and asks what truly influenced the outcome. A channel may receive credit inside reports while adding little real impact. Teams relying only on attribution often overestimate channels that capture existing demand rather than create new customer interest.
India offers useful geographic variation for experiment design because consumer behaviour differs across metros, Tier-1, Tier-2, and Tier-3 cities. Many D2C brands can build reliable market comparisons from that structure. The bigger challenge is volume. Cities with lower conversion numbers often struggle to produce dependable findings within shorter test periods.