
What this blog covers
This is the pillar guide to scaling performance marketing profitably. It explains why last-click ROAS breaks down as spend grows, sets out the model for profitable scale a blended efficiency floor, contribution margin as the ceiling test, incrementality as the referee, and creative and demand as the fuel and shows how the pieces work together. It closes with a self-check and the questions leaders ask most.
Table of Contents
- The meeting that starts with an argument
- Why every dashboard tells a different story
- What a single source of truth is
- The Single-Source-of-Truth Stack
- Define each metric once
- Governance: keeping it true over time
- Self-check: Do you have one source of truth?
- Key takeaways
- Closing
- Tired of every dashboard telling a different story?
The meeting that starts with an argument
In a lot of marketing organisations, the weekly review opens the same way: someone shares a number, someone else shares a different number for the same thing, and the next ten minutes go to working out whose is right instead of what to do. The platform says one revenue figure, the analytics tool says another, the finance export says a third, and the meeting spends its energy reconciling rather than deciding. It costs time, and worse, it costs confidence, because when the numbers cannot be trusted, decisions get deferred or made on gut.
A single source of truth removes that friction. It gives the whole team one agreed set of numbers, defined the same way for everyone, so the meeting can start where it should with the decision. Building one is less a technology project than an agreement about definitions, supported by the right plumbing.
Why every dashboard tells a different story
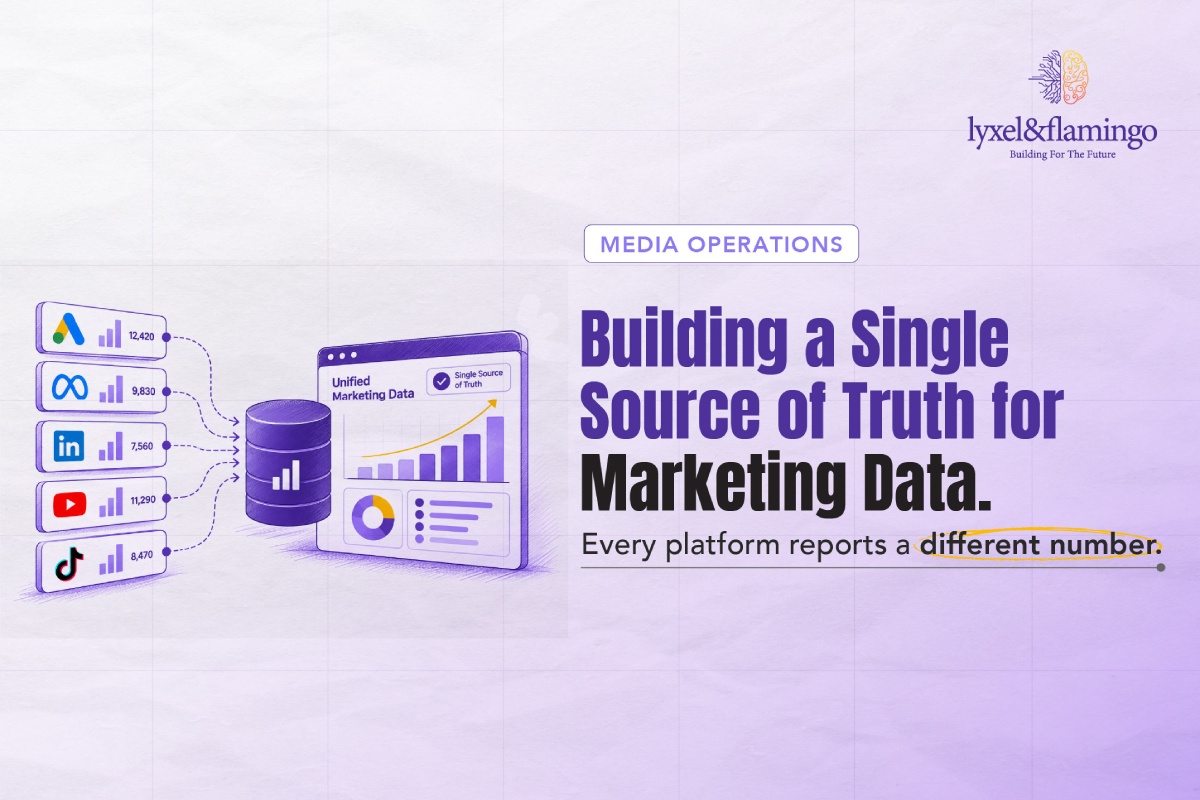
The dashboards disagree for reasons that are entirely predictable once you look. Each ad platform attributes conversions with its own logic and claims credit for the same sale, so their totals overlap and add up to more than really happened. Analytics tools count sessions and users differently from how platforms count clicks. Time zones, currency conversions and attribution windows differ from one system to the next. And the same word a conversion, a lead, an active user is defined differently in each tool. None of these systems is broken; they are simply answering slightly different questions and were never told to agree.
This is why bolting one more dashboard on top rarely helps it becomes a sixth opinion rather than a resolution. The fix is structural: bring the data together and define it once, which is the same discipline that underpins a sound measurement framework.
What a single source of truth is
A single source of truth is one place where marketing data from every system is collected, joined, and defined consistently, so that any metric means the same thing wherever it appears. It is not necessarily a single tool or a single dashboard; it is a single, agreed definition and a single reconciled store behind whatever dashboards a team uses. When revenue, conversions, or MER are quoted, they trace back to the same underlying numbers, calculated the same way.
The point is trust rather than novelty. A single source of truth does not invent new metrics; it makes the existing ones dependable, so that finance and marketing can look at the same figure and agree what it means. That shared trust is what lets an organisation move from arguing about data to acting on it.
The Single-Source-of-Truth Stack
Producing that trusted number takes four layers, each building on the one below.
Framework: The Single-Source-of-Truth Stack from scattered sources to one reconciled dashboard.
At the base sit the sources and the pipeline: GA4, the ad platforms, the CRM, and offline systems, collected through clean, consistent ingestion. Above that is the warehouse, a single store, such as BigQuery, where every source is joined, and each field is defined once, so the same conversion is not counted three different ways. On top of the warehouse sits the modelling layer, where the business logic lives: blended metrics, attribution, incrementality adjustments, all applied in one place rather than re-invented in each report. And at the top is the dashboard – the reconciled KPIs that finance and marketing both sign off on. Because every layer draws from the one below, a number on the dashboard can always be traced back to a single, agreed definition in the warehouse.
Define each metric once
The technical stack matters, but the decisive move is organisational: defining each metric once, at the warehouse, and holding everyone to that definition. A conversion, a lead, an active customer, MER, contribution margin each needs a single written definition that every dashboard inherits, rather than each team calculating its own. This is where most single-source-of-truth efforts succeed or fail. A team can build a warehouse and still have chaos if three dashboards define a conversion three ways. Agree the definitions first, encode them in the modelling layer, and the tools downstream stop disagreeing because they are all reading the same logic. It is the least glamorous part of the work and the part that actually ends the argument.
Governance: keeping it true over time
A single source of truth is not built once and left alone; it drifts the moment someone adds an untracked campaign, a new platform, or a private spreadsheet with its own version of the numbers. Keeping it true takes light governance: a clear owner for the definitions, a process for adding new sources and metrics through the warehouse rather than around it, and the discipline of pointing every report back to the agreed source rather than tolerating shadow dashboards. The aim is consistency without bureaucracy: a system where new data strengthens the single source instead of fragmenting it, so the trust the team has built does not quietly erode. This is where marketing operations and technology meet, and it is what turns a one-off dashboard project into a durable capability.
Self-check: Do you have one source of truth?
Score your own setup one point per yes:
- Marketing data from every system is joined in one store, not compared across tools
- Each key metric has a single written definition every dashboard inherits
- Finance and marketing accept the same numbers without reconciling
- Platform-reported figures are treated as inputs, not the final truth
- There is a named owner for metric definitions and new sources
- New campaigns and platforms are added through the warehouse, not around it
- Meetings start with the decision, not an argument about whose number is right
Five or more and you have a working single source of truth. Three or fewer and your team is probably still reconciling instead of deciding.
Key takeaways
- Platform dashboards disagree by design: different attribution, definitions, time zones, and windows.
- Adding another dashboard makes it worse; the fix is to bring data together and define it once.
- A single source of truth is one reconciled store, and one agreed definition behind whatever dashboards you use.
- The stack is four layers: sources and pipeline, warehouse, modelling, dashboard, each tracing to the one below.
- Defining each metric once, with an owner and light governance, is what actually ends the argument.
Closing
The value of a single source of truth is easy to underrate because it produces no new numbers; it just makes the existing ones trustworthy. But that trust is what everything else runs on. When a team stops litigating whose figure is right, the meetings get shorter, the decisions get faster, and the whole organisation starts acting on evidence rather than arguing about it. The work is unglamorous: definitions, pipelines, governance, but the payoff is the quiet confidence of a business that agrees on what its numbers mean.
Tired of every dashboard telling a different story?
L&F builds the single-source-of-truth stack: clean pipelines, one reconciled warehouse, agreed definitions, and dashboards finance and marketing both trust for consumer brands across India and worldwide. We will end the argument about whose number is right. Talk to L&F about marketing data and start meetings with the decision, not the debate.
Frequently Asked Questions
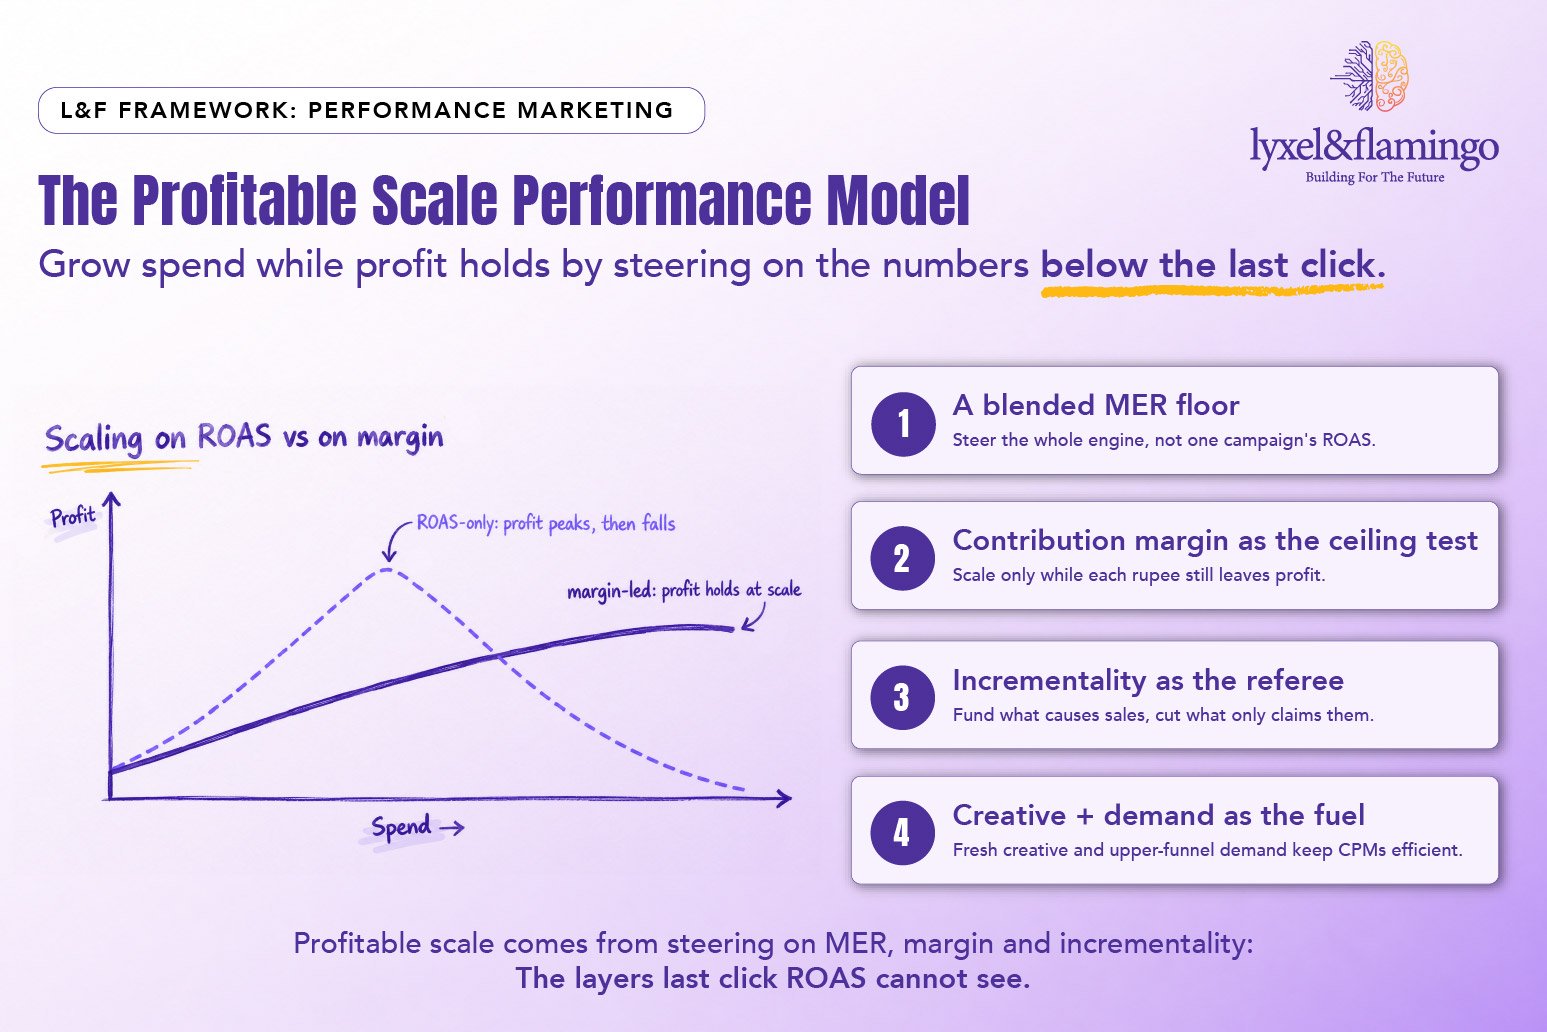
Profitable performance marketing is scaling paid media in a way that grows revenue while protecting profit, rather than chasing the highest reported return. In practice it means steering on blended efficiency (MER) rather than campaign ROAS, using contribution margin to decide how far to scale, proving effects with incrementality, and keeping creative and demand fresh so costs stay efficient as budgets grow. The goal is durable growth the business banks, not an efficient-looking dashboard.
Because early spend harvests the warmest, cheapest demand people already close to buying and the platform credits those easy conversions to your ads. As you spend more, that ready-made demand runs thin, and each additional rupee has to reach less-ready people, so the real cost of a new customer rises. Reported ROAS can also stay deceptively steady while true incremental returns fall, which is why scaling on it alone leads to the wall.
Steer on the right numbers. Use blended MER to judge the whole engine rather than one campaign's ROAS; use contribution margin as the ceiling test, scaling only while the next rupee still leaves profit; use incrementality to check the sales are caused, not just harvested; and keep fresh creative and upper-funnel demand feeding the engine so costs stay efficient. Raise budgets gradually and watch cost per acquisition and margin, not just reported ROAS.
A layered view: Blended MER to steer overall efficiency, contribution margin to decide how far to scale and whether growth is profitable, and incrementality to prove what the media actually caused. Last-click ROAS still has a role in day-to-day campaign optimisation, but it should not be the number you scale the business on, because it hides the rising cost of new demand and double-counts conversions across platforms.
Creative is one of the biggest levers for scaling profitably, because as budgets grow the same audiences see the same ads more often, response fatigues, and costs rise. Fresh, funnel-matched creative keeps the engine fed and, because the algorithm reads creative to decide who to find next, effectively acts as targeting. Brands that resource creative as a scaling lever push the wall further out; those that do not hit rising costs sooner, no matter how well the media is bought.
Performance marketing captures demand; if nothing refills the pool of demand, scaling simply harvests a shrinking pool at rising cost. Upper-funnel demand creation reach and brand-building keeps refilling that pool, so the performance engine has warm, aware audiences to convert cheaply. This is why the most profitable performance programmes are not purely lower-funnel: they are fed by demand creation, which keeps acquisition costs down as spend grows.
When the next rupee of spend no longer leaves contribution margin behind - that is the ceiling test. Warning signs on the way there include cost per acquisition climbing at flat or falling volume, blended MER deteriorating as budget rises, and incrementality tests showing that added spend is mostly harvesting existing demand rather than creating new sales. Reading media as a P&L makes the point of diminishing profit visible before you spend past it.