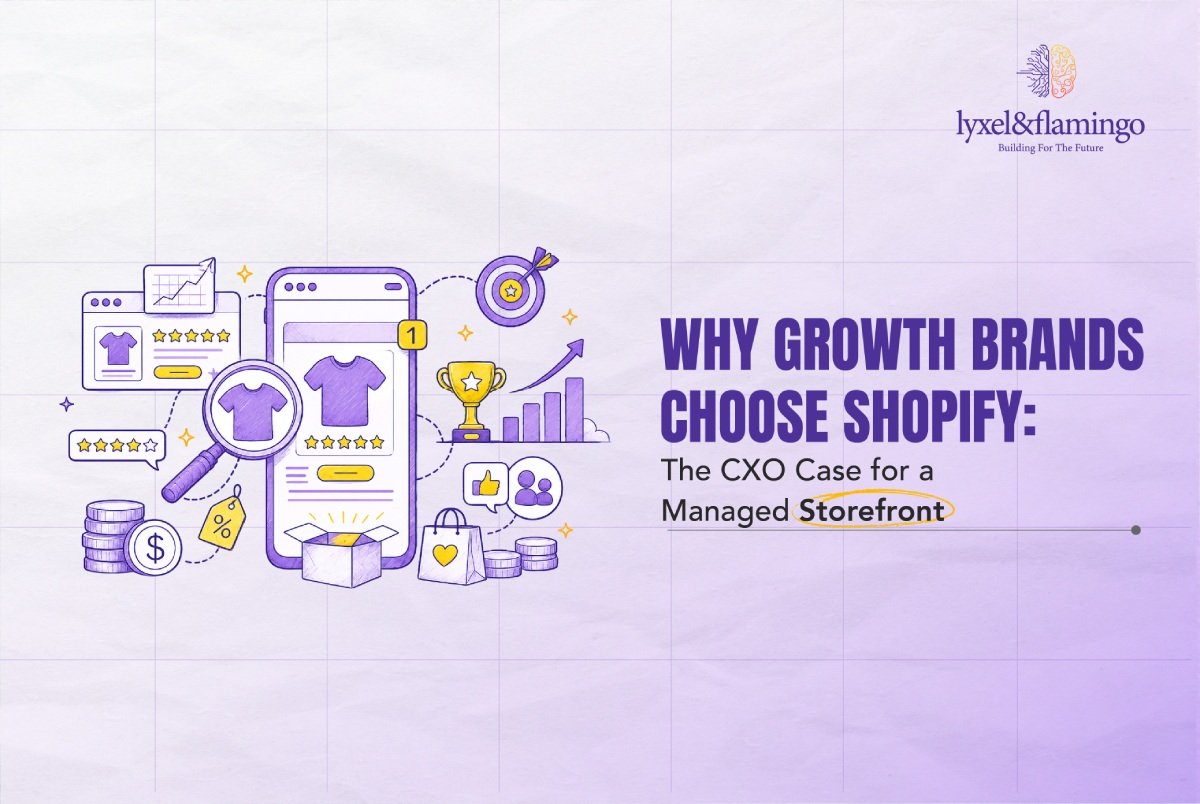

What this blog covers
Going direct is not the goal; going direct profitably is. This blog starts with the economics a D2C storefront has to satisfy, then sets out the five-layer performance stack (and the operational realities, from COD to logistics) that decide whether your direct channel compounds margin or quietly burns it. It is written for the brand and growth leaders who own that P&L.
Table of Contents
- What is a high-performing D2C storefront?
- Why this matters now: the D2C growth equation
- The real pain points
- Framework: The Storefront Performance Stack
- Real-World Scenario: O3+ and Columbia (and an adjacent proof)
- Going Deeper: Your Pre-launch and Unit Economics Checklist
- Key Takeaways
- Closing Thoughts
What is a high-performing D2C storefront?
A high-performing D2C storefront is a brand-owned digital channel website, progressive web app or mobile experience engineered to acquire customers at a cost your margin can sustain, convert them efficiently, and bring them back often enough that lifetime value comfortably exceeds acquisition cost. It is not a marketplace listing you decorate; it is a P&L you control, powered by first-party data no intermediary can take away.
Why this matters now: the D2C growth equation
The pull towards direct is real-marketplace fees, algorithm dependency and zero first-party data all erode margin and control. But the D2C graveyard is full of brands that confused launching a storefront with building a profitable one. The difference is economics.
Every D2C storefront has to satisfy one equation the lifetime value of a customer (LTV) must comfortably exceed the cost to acquire them (CAC), and the contribution margin per order has to cover the cost of serving it. In practice that means a CXO should be watching four numbers, not a vanity revenue line: CAC, AOV, repeat-purchase rate and LTV: CAC with a clear view of payback period and blended marketing efficiency (MER). A storefront that lifts conversion and repeat rate improves every one of those numbers at once; a storefront that only chases traffic makes them worse.
The performance gap is where that equation is won or lost. The average documented cart-abandonment rate is 70.19%, and 47% of shoppers abandon specifically because of extra costs surfaced too late in checkout (Baymard Institute, 2024), nearly half of all abandonment addressable by checkout design alone. Speed feeds the same equation: a 0.1-second improvement in mobile load time lifts retail conversions by 8.4% and average order value by 9.2% (Deloitte/Google, 2020). And retention economics reward personalisation: McKinsey found that faster-growing companies drive 40% more of their revenue from personalisation than their slower-growing peers (McKinsey, 2021). None of these are design niceties; each one moves CAC, AOV or LTV directly.
The real pain points
- No grip on unit economics: Brands track gross revenue and ROAS but not CAC, contribution margin, repeat rate or LTV:CAC, so they cannot tell whether growth is profitable or subsidised.
- Over-reliance on paid acquisition: When the storefront has no retention engine, every sale must be re-bought through ads, and rising CAC silently erases margin.
- Operational realities treated as back-office: In markets like India, COD, UPI and one-tap payments, WhatsApp-led journeys, and logistics, returns and RTO are commercial variables, a high RTO rate on COD can wipe out the margin a great PDP just earned.
- Checkout friction disguised as normal: Surprise shipping costs, too many form fields and no guest checkout are structural revenue failures that feel invisible until you benchmark them.
- Personalisation without a data strategy: Recommendation widgets deliver little unless fed by quality first-party data and tested the very data a D2C channel exists to capture.
- Conversion leaks that go unmeasured: Most brands never instrument the micro-drop-offs (listing to PDP, PDP to cart, cart to checkout, checkout to payment) where the equation actually breaks.
Framework: The Storefront Performance Stack
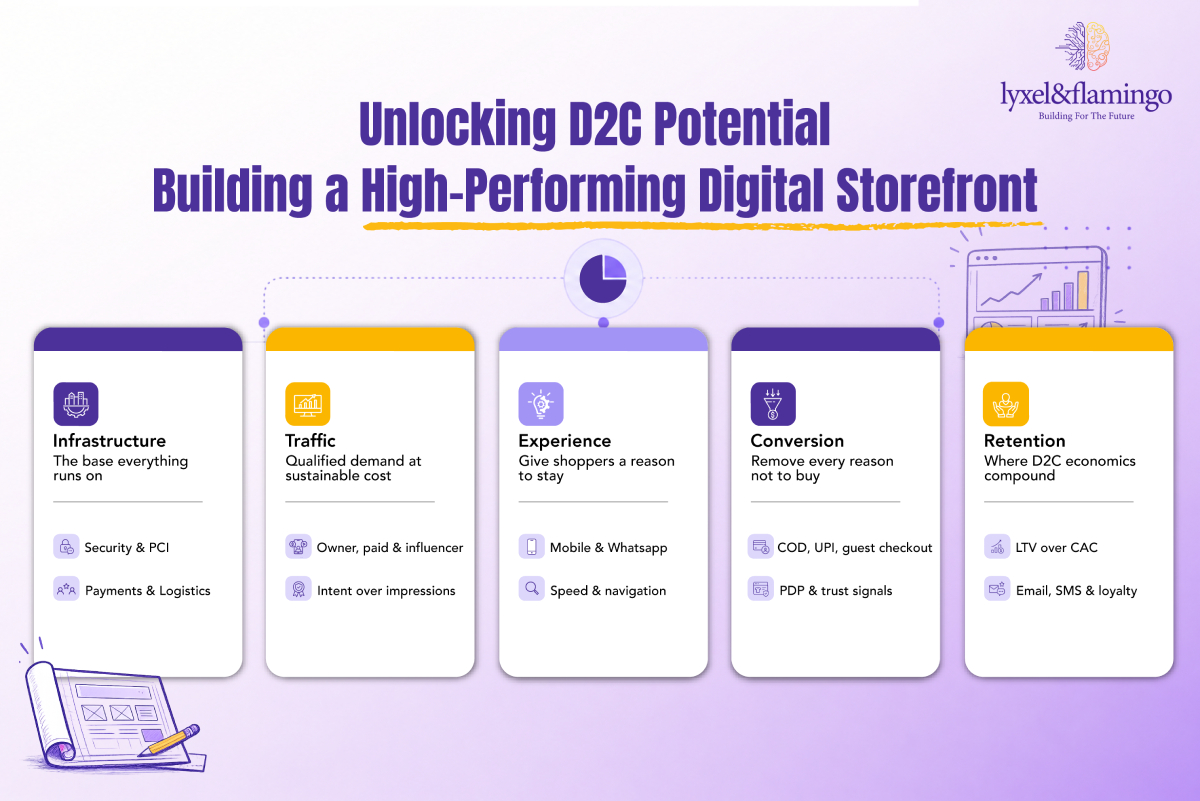
Treat a D2C storefront as five layers built from the foundation up. Each layer relies on the one beneath it, and the model doubles as a diagnostic: find your weakest layer before you spend another rupee on traffic.
The Framework explained
Layer 1-Infrastructure:
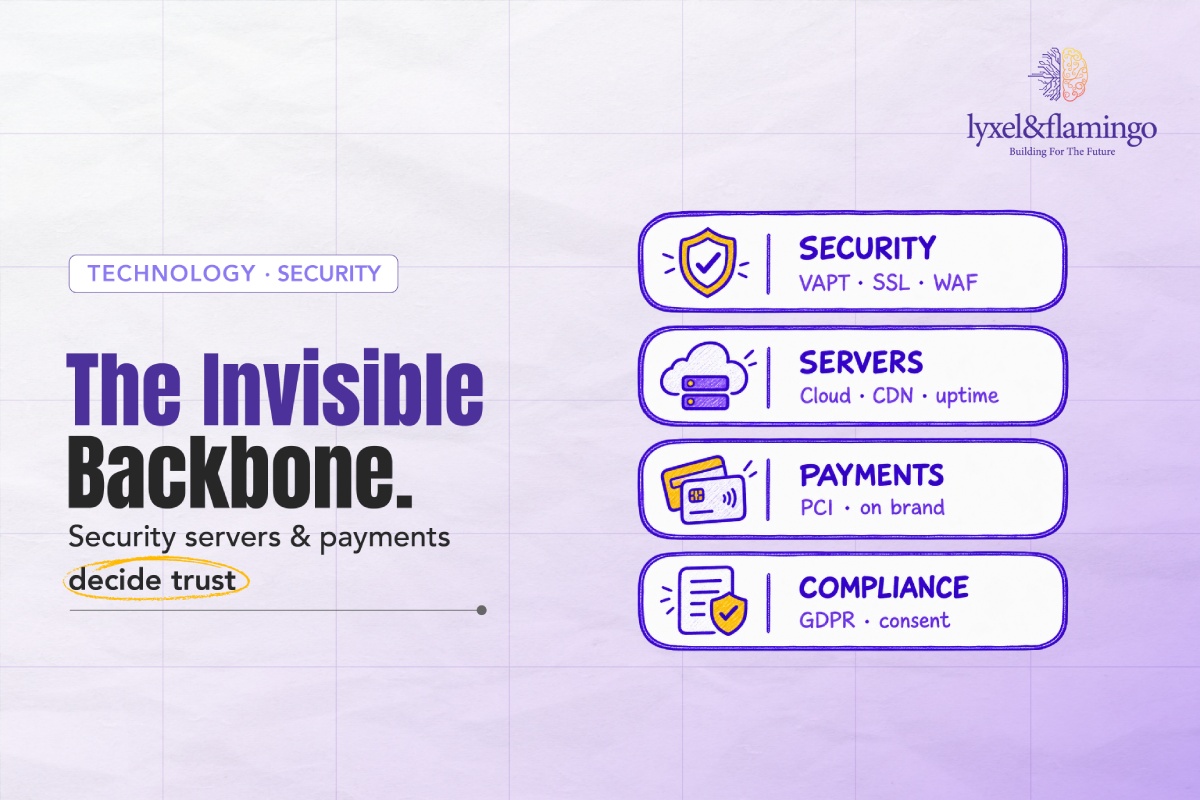
Everything else sits on this: hosting, CDN, security and PCI compliance, plus the payment and logistics integrations that make commerce actually happen. In practice this is where India-specific realities live: UPI and card gateways, COD handling, and courier/fulfilment integrations that manage returns and RTO. Treated as an IT afterthought, it fails publicly during your biggest trading moment; owned as a commercial commitment, it is invisible and reliable. The failure mode is discovering your infrastructure limits during a launch or sale, exactly when the cost of failure is highest.
Layer 2-Traffic:
Traffic is qualified intent arriving at a cost your margin can sustain, not raw volume. The CXO test is blended CAC across channels and whether the intent behind each click is convertible. Chasing cheap impressions flatters awareness while draining conversion rate and inflating CAC. Note that the strongest D2C traffic is increasingly owned email, SMS, WhatsApp and community because it costs nothing to re-reach and it is the cheapest way to keep LTV ahead of CAC.
Layer 3-Experience:
Experience is every signal a shopper receives between landing and deciding. Speed is the most underestimated variable; a page that takes four seconds on a mid-range Android handset has lost a material share of its audience before a product loads. Navigation must get a shopper to intent in two or three taps, and for many Indian D2C brands the journey now begins or continues on WhatsApp, not just the website. Personalisation is not a separate layer; it is a capability that runs across Experience, Conversion and Retention, tailoring what each shopper sees.
Layer 4-Conversion:
Conversion is where every upstream rupee is recovered or written off, and it turns on three moments: the PDP, the cart and the checkout. Structural leaks surprise fees, missing trust signals, a variant selector that hides stock, no guest checkout, or a checkout that does not offer COD and UPI where buyers expect them are revenue problems with known fixes. Commission a conversion audit before any acquisition-budget increase; plugging leaks almost always out-returns buying more traffic to fill them. (Your product pages carry most of this load, they deserve their own attention.)
Layer 5-Retention:
Acquisition is paid once; a retained customer pays back across every repeat order, which is precisely where D2C unit economics turn attractive. A deliberate programme-email and SMS flows, WhatsApp, loyalty, subscriptions are what pull LTV clear of CAC. A brand without a retention layer is running a one-time-sale business on the cost base of a relationship one. This is also where your first-party data becomes a compounding asset rather than a by product.
Real-World Scenario: O3+ and Columbia (and an adjacent proof)
O3+, India’s leading professional skincare brand, is the stack done right end to end. The brand was leaking direct sales to marketplaces while running a self-hosted Magento 2.0 storefront that had become a drag. L&F re-platformed it to Shopify with a full 301-redirect migration to protect search equity (Infrastructure), rebuilt the shopping experience around a faster, mobile-first journey and clearer product storytelling (Experience and Conversion), and layered retention automation on top (Retention). Every layer moved, and so did the economics: 569% organic revenue growth, 160% growth in organic transactions and 163% overall growth within six months, with a further 22X ROI from retention automation. The same pattern holds in Biotique’s organic growth story , another D2C brand where fixing the fundamentals, not buying more media, drove the results.
The model travels beyond retail, too: in adjacent health-commerce, the same stack discipline took Agilus from 278,000 to 341,000 monthly users in a year; a 22% rise driven by a platform finally able to convert intent, not by extra ad spend. Different category, same principle: fix the weakest layer and growth compounds without proportional media cost.
Going Deeper: Your Pre-launch and Unit Economics Checklist
Run these at the CXO level before you launch or rebuild.
- Do you track CAC, AOV, repeat rate and LTV:CAC, not just revenue and ROAS?
- Is payback period and blended MER visible to leadership monthly?
- Core Web Vitals targets set and tested on a mid-range mobile handset?
- Checkout tested for surprise-cost moments (shipping, taxes, fees)?
- Guest checkout, UPI and COD supported where your buyers expect them?
- RTO and returns cost modelled into COD contribution margin?
- WhatsApp and owned channels built into acquisition and retention?
- First-party data capture built into the post-purchase flow?
- CDN, security (SSL, PCI, DDoS) and logistics integrations confirmed?
- Analytics configured to capture per-layer drop-off, not just revenue?
Key Takeaways
- Going direct only wins if it is profitable: the storefront exists to keep LTV comfortably ahead of CAC, so track CAC, AOV, repeat rate and LTV: CAC, not just revenue.
- The Storefront Performance Stack is built foundation-up (Infrastructure > Traffic > Experience > Conversion > Retention) and doubles as a diagnostic: fix the weakest layer first.
- Operational realities are commercial: COD, UPI, WhatsApp, logistics and RTO can make or break the margin your storefront earns.
- Checkout and speed are the fastest economic wins 70% of carts are abandoned, 47% over surprise costs (Baymard), and a 0.1-second speed gain lifts conversion by 8.4% (Deloitte/Google).
- Retention is where the economics compound; personalisation, powered by first-party data, drives faster-growing companies’ revenue (McKinsey).
Closing Thoughts
A high-performing D2C storefront is not a launch; it is an operating discipline anchored in economics. The brands that compound growth year on year are those whose leaders read every layer of the stack through a single lens is this improving CAC, AOV or LTV? The 70% abandonment benchmark, the 8.4% speed-to-conversion relationship, the personalisation revenue premium and your own COD and RTO rates are not academic figures; they are the coordinates of where your storefront is earning or leaking margin right now. The CXO’s job is to know which and to fix the weakest layer before a competitor fixes theirs.
Frequently Asked Questions
Beyond revenue: CAC, AOV, repeat-purchase rate and LTV:CAC, plus payback period and blended MER (marketing efficiency ratio). These tell you whether growth is profitable or subsidised. Contribution margin per order after COD, shipping and RTO is the number that keeps you honest.
Start with checkout: reveal all costs early, offer guest checkout, reduce form fields, and support the payment methods buyers expect (UPI, cards, COD). Then fix speed. Finally, add cart-abandonment email/SMS/WhatsApp flows to recover intent after the fact.
Treat RTO as a margin line, not a logistics footnote. Model return-to-origin and refund costs into your COD contribution margin, use address and intent signals to reduce risky COD orders, and nudge prepaid (UPI) with small incentives where it protects margin.
It depends on catalogue complexity, in-house engineering and growth stage. Both can be built to perform; for most brands scaling without a large tech team, a managed platform reduces the infrastructure burden. See the D2C website guide for the features your
When conversion has plateaued despite healthy traffic, when mobile speed is consistently poor, when the platform needs disproportionate engineering to maintain, or when it cannot support the payments, logistics, retention and personalisation your economics now require.